Figures & data
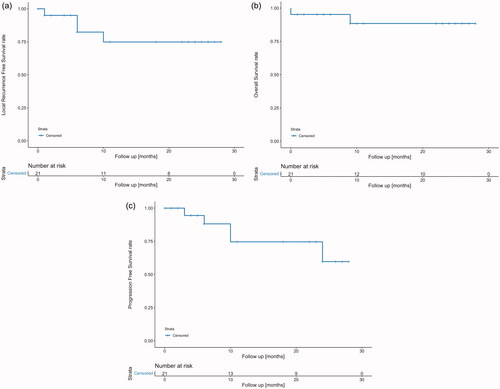
Figure 1. Schema of study treatments.
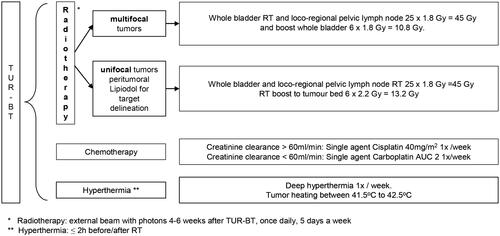
Figure 2. Consort diagram. n: number of patients.
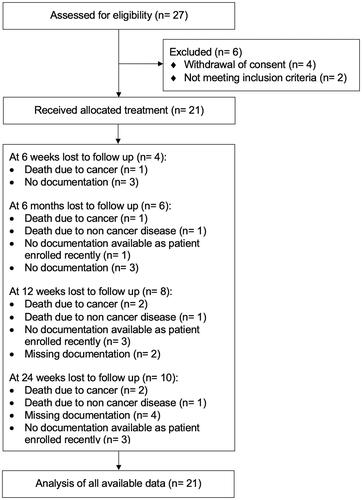
Table 1. Patient- and treatment-related characteristics.
Figure 3. Disease status of study patients after 1.5, 6, 12 and 24 months. Each line represents one patient, n = 21. The time point 0 refers to the end of treatment. A red column between 0 and 1.5 months indicates complete response (CR) at 1.5 months with the assumption that CR was achieved sometimes within this 6-week time period. Similarly, a blue column starting after 1.5 months indicates confirmed local or locoregional recurrence at the 6-month time point. Locoregional recurrences occurred in 4 patients, 3 local and 1 regional. In two patients information about disease status during follow-up is missing, one of the two patients died early after treatment. For each patient, HT treatment data are listed (left); in the first column: mean of values of total CEM43 °C during the treatment course and in the second column: number of total HT sessions. n.r.: not reported.
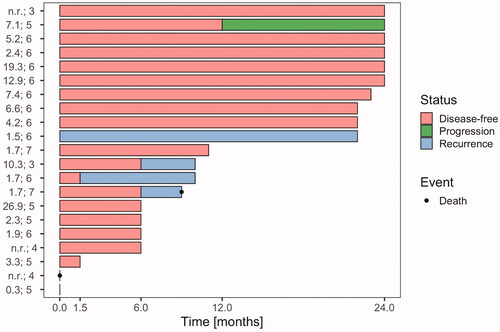
Table 2. Complete response (CR) rates six weeks, 6, 12 and 24 months after treatment.
Table 3. Acute and late genitourinary (GU) toxicity.
Table 4. Acute and late gastrointestinal (GI) toxicity.
Table 5. Quality of life using QLQ-C30 and QLQ-BLM30.
Figure 4. 2-year (a) progression-free survival, (b) overall survival and (c) local recurrence-free survival rates.