
Figures & data
Figure 1. MRI sagittal view of a patient with uterine fibroid. (a) the distance from ventral surface of the fibroid to skin, (b) the distance from dorsal surface of the fibroid to sacrum, (c) thickness of abdominal wall.
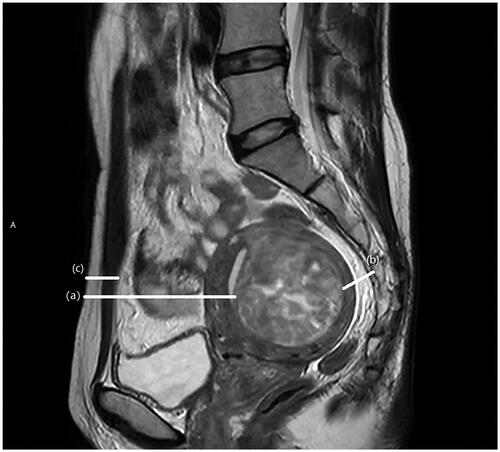
Figure 2. The location of the endopelvic fascial edema. (a-d) MR images before USgHIFU ablation. (e) Anterior wall fascial edema; (f) posterior wall fascial, right lateral wall fascial, peri-vesical fascial, and perirectal fascial edema; (g) posterior wall fascial, left lateral wall fascial edema; (h) peri-uterine fascial, posterior wall fascial, and perirectal fascial edema.
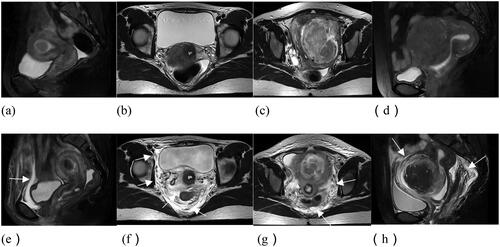
Figure 3. A 44 years old patient with fibroid. (a-d) MRI images before USgHIFU ablation. (e-h) MRI images after USgHIFU ablation. (a) Pre-USgHIFU a sagittal T2WI image showed a posterior wall fibroid that is almost hyperintense on T2WI. (e-f) Fascial edema was shown as a high-intensity signal on T2WI and diffusion-weighted imaging (arrow).
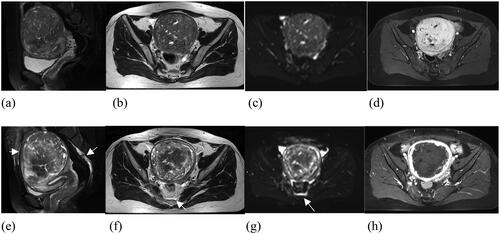
Figure 4. Violin plot analysis of each quantitative parameter between the edema and non-edema groups (a–i). White dash lines represent median values. TD: therapeutic dose; EEF: energy efficiency factor
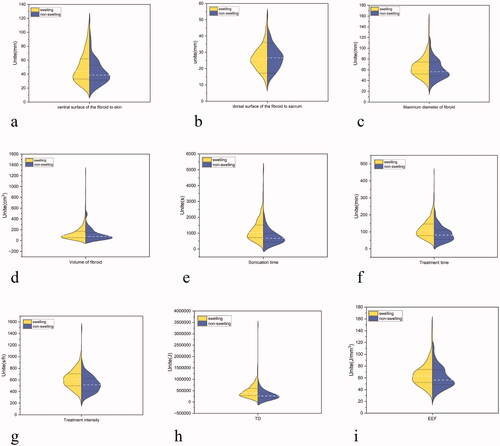
Table 1. Univariate analysis to evaluate the relationship between the endopelvic fascial edema and fibroid features.
Table 2. Univariate analysis to evaluate the relationship between the endopelvic fascial edema and ultrasound ablation parameters.
Table 3. Multivariable binary logistic regression analysis to evaluate the correlation of fascial edema with the significant factors of univariate analysis.
Table 4. Summary of postprocedural adverse events.
Table 5. Relationship between the pain-related adverse events and location of endopelvic fascial edema.
Table 6. Relationship between the lateral location of fibroids and parietal fascial edema/lower limb discomfort.
Supplemental Material
Download PDF (271.4 KB)Data availability statement
The data that support the findings of this study are available from the corresponding author, Furong Lv and Zhibo Xiao, upon reasonable request.