
Figures & data
Figure 1. Flowchart for the patient selection and study design.
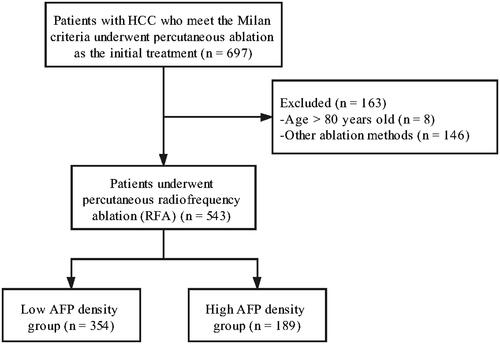
Table 1. Characteristics of the study patients.
Figure 3. Restricted cubic spline model for the association of AFP density with (a) overall survival (OS) and (b) progression-free survival (PFS). Shaded regions indicate 95% confidence bands for risk of outcomes as log function of AFP density. HR, hazard ratio.
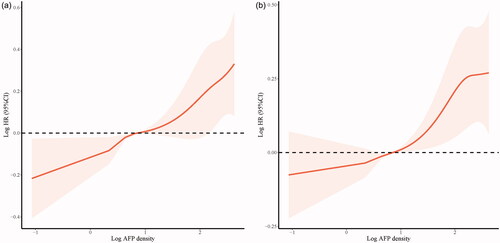
Table 2. Univariate analysis using Cox regression for overall survival and progress-free survival.
Table 3. Multivariate analysis using Cox regression for overall survival and progress-free survival.