
Figures & data
Figure 1. (a) Physical situation to be modeled with an active cooling device located in the esophageal lumen. (b) Model geometry including RF catheter, tissues near the ablation site and an active cooling device located in the esophageal lumen. The evaluation line (black line) for post-processing is shown across the ablated tissues, from tip of RF catheter to edge of active cooling device (with tissues including myocardium, fat and esophagus).
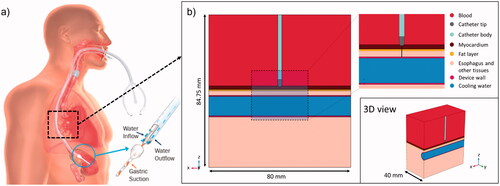
Table 1. Material properties of the computer model.
Figure 2. General view (a) and zoom-in (b) of the meshing around the electrode with 162,322 total elements and 102,250 around the catheter electrode. The color legend represents skewness element quality. Histograms of element quality around the electrode showing the skewness (c), volume versus length (d) and growth rate (e).
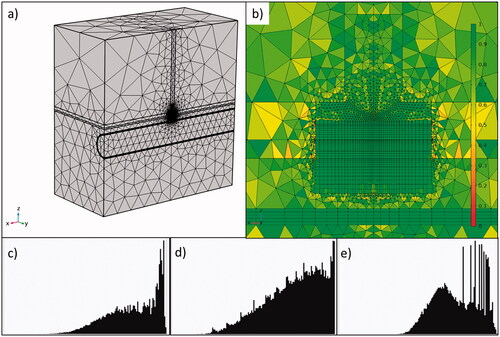
Figure 3. Progress of electrical variables (power, impedance, current and voltage) during RF pulse using 50 W/10s (top) and 90 W/4s (bottom). Note that power is almost constant during the RF pulse, with variations less than 2 W.
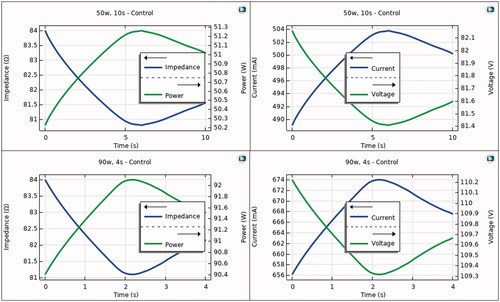
Figure 4. Temperature distributions during HPSD ablation using 50 W/10s and 90 W/4s, with (protection) and without (control) proactive esophageal cooling (scale in °C).
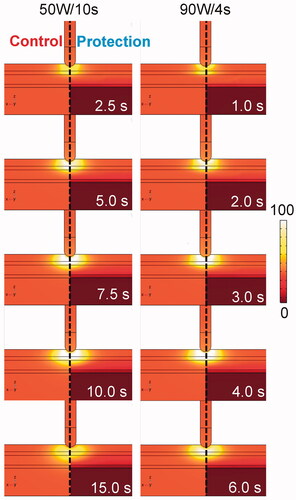
Figure 5. Temperature progress computed at different locations below the electrode during and after RF pulse for 50 W/10s and 90 W/4s, with (protection) and without (control) proactive esophageal cooling. Device wall and cooling water correspond to esophageal tissue in the control case in which no esophageal thermal cooling is used.
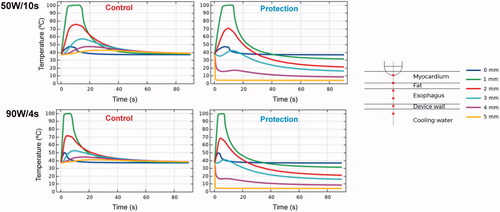
Figure 6. Lesion shapes (computed with fraction of damage θd = 63% after 90 s with the Arrhenius model) for 50 W/10s and 90 W/4s, with (protection) and without (control) proactive esophageal cooling. Left sided images show the case after the RF pulse, right sided images show the case after 90 s.
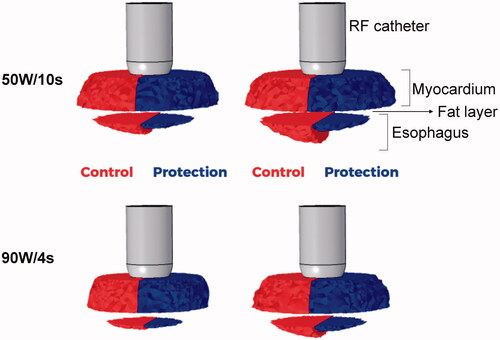
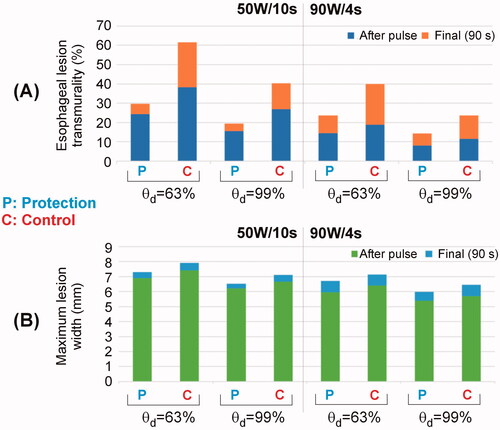
Figure 7. Esophageal lesion transmurality (a) and maximum lesion width in the myocardial wall (b) computed with two fractions of damage θd (63% and 99%) just after the RF pulse and after 90 s, for 50 W/10s and 90 W/4s, and with (Protection) and without (Control) proactive esophageal cooling.
Data availability statement
The data underlying this article will be shared on reasonable request to the corresponding author.