1,376
Views
3
CrossRef citations to date
0
Altmetric
Articles

Evaluating the long-term survival benefits of high intensity focused ultrasound ablation for hepatocellular carcinoma with portal vein tumor thrombus: a single center retrospective study

ORCID Icon, ORCID Icon, ORCID Icon, ORCID Icon, ORCID Icon, ORCID Icon, ORCID Icon, ORCID Icon & ORCID Icon show all
Pages 1245-1253 | Received 30 Mar 2022, Accepted 02 Sep 2022, Published online: 22 Sep 2022

Figures & data

Figure 1. Flowchart of patient selection.

Figure 1. Flowchart of patient selection.

Table 1. Patient characteristics (n = 144).

Table 2. Perioperative adverse events of HIFU ablation.

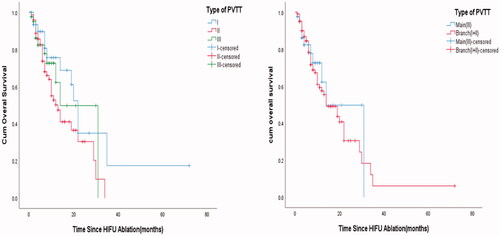
Table 3. Overall survival of PVTT and its subgroups.

Figure 2. (A) Kaplan–Meier’s curves show OS of PVTT type I, II and III. (B) Kaplan–Meier’s curves show OS of main (type III) and branch (type (I + II)) PVTT.

Figure 2. (A) Kaplan–Meier’s curves show OS of PVTT type I, II and III. (B) Kaplan–Meier’s curves show OS of main (type III) and branch (type (I + II)) PVTT.

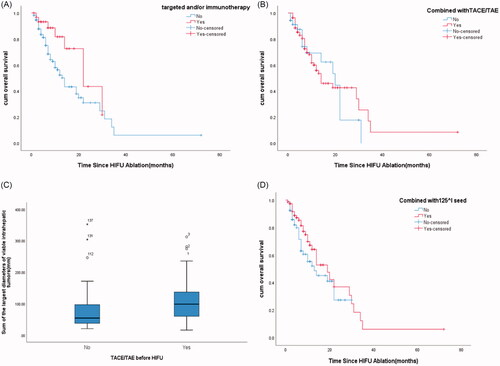
Table 4. OS and AEs of various treatment options for HCC complicated with PVTT.

Figure 3. (A) Kaplan–Meier’s curves show OS of targeted and/or immunotherapy and non-targeted nor immunotherapy. (B) Kaplan–Meier’s curve shows the OS of TACE/TAE and non-TACE/TAE. (C) Boxplots show the tumor size of TACE/TAE and non-TACE/TAE. (D) Kaplan–Meier’s curve shows the OS of 125I seed-HIFU and non-125I seed-HIFU.

Figure 3. (A) Kaplan–Meier’s curves show OS of targeted and/or immunotherapy and non-targeted nor immunotherapy. (B) Kaplan–Meier’s curve shows the OS of TACE/TAE and non-TACE/TAE. (C) Boxplots show the tumor size of TACE/TAE and non-TACE/TAE. (D) Kaplan–Meier’s curve shows the OS of 125I seed-HIFU and non-125I seed-HIFU.

Data availability statement

All data are available upon request.