
Figures & data
Figure 1. The significant scale changes during HIFU treatment for breast fibroadenoma. A: Pre-HIFU ultrasound showed a hypoechoic breast fibroadenoma. B: Intra-HIFU ultrasound showed a significant hyperechoic scale changes emerging during HIFU (white arrow). C: Post-HIFU ultrasound showed that the significant hyperechoic scale change covered the whole fibroadenoma.
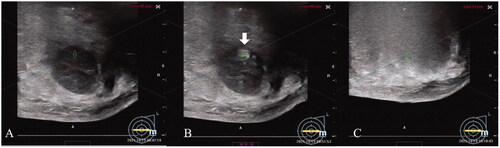
Figure 2. The trend of the treatment time and CUSUM in the two centers. A: The trend of the treatment time in HIFU treatment of breast fibroadenoma in Center 1. B: The learning curve (CUSUM chart) of HIFU treatment time in Center 1 (60 was the vertex of the curve). C: The trend of the treatment time in HIFU treatment of breast fibroadenoma in Center 2. D: The learning curve (CUSUM chart) of HIFU treatment time in Center 2 (65 was the vertex of the curve).
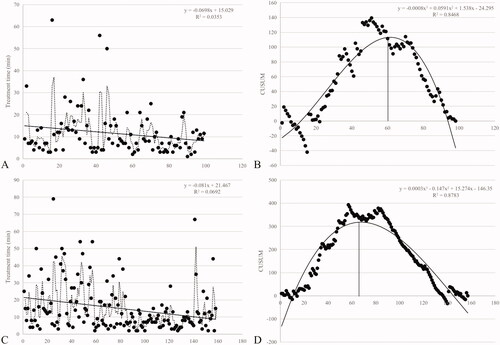
Table 1. Baseline characteristics of patients in two centers.
Table 2. Baseline characteristics of lesions in two centers.
Figure 3. The box plot of screening time, treatment time, sonication time and hyperechoic scale change emerging time between groups in the two centers. A: Screening time. B: Treatment time. C: Sonication time. D: Hyperechoic scale change emerging time. *p < 0.05; **p < 0.01; ***p < 0.001; ****p < 0.0001.
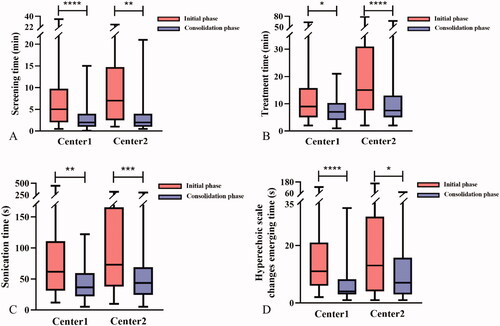
Figure 4. The box plot of sonication energy, NPV ratio, EEF and intra-treatment VAS scores between groups in the two centers. A: Sonication energy. B: NPV ratio. C: EEF. D: Intra-treatment VAS scores. *p < 0.05; **p < 0.01.
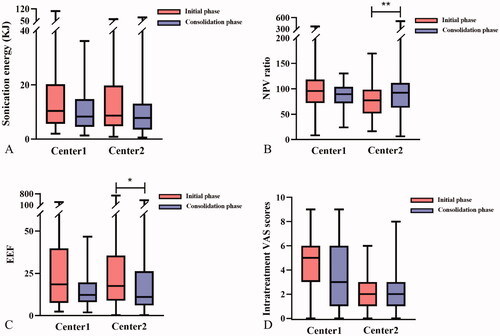
Table 3. HIFU treatment results for fibroadenoma in two centers.