
Figures & data
Figure 1. Three-dimensional contrast-enhanced ultrasound volumetric images (A–D).
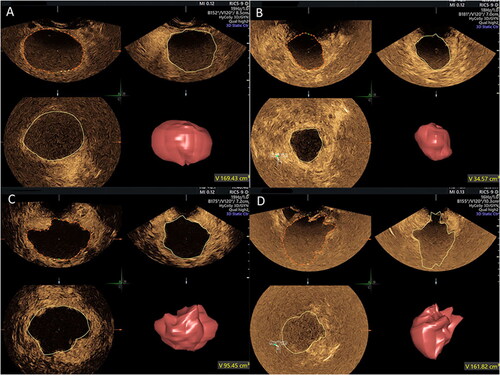
Figure 2. Three-dimensional contrast-enhanced magnetic resonance imaging (A–F).
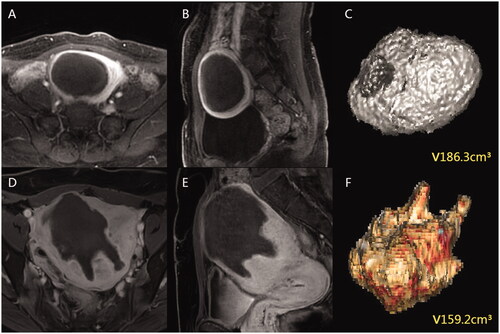
Figure 3. Bland–Altman plot of NPV measurements obtained via 2D-CEUS and 3D-CEMRI. (A) all patients; (B) patients with UM; (C) patients with AM; (D) patients with maximum diameter ≥5 cm; (E) patients with maximum diameter <5 cm.
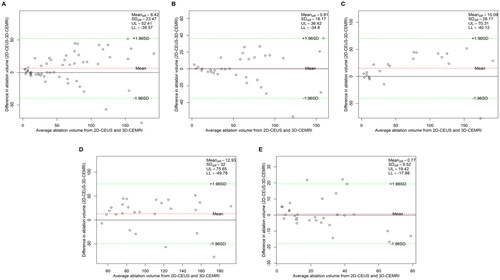
Figure 4. Bland–Altman plot of NPV measurements obtained via 3D-VOCAL and 3D-CEMRI. (A) All patients; (B) patients with UM; (C) patients with AM; (D) patients with maximum diameter ≥5 cm; (E) patients with maximum diameter <5 cm.
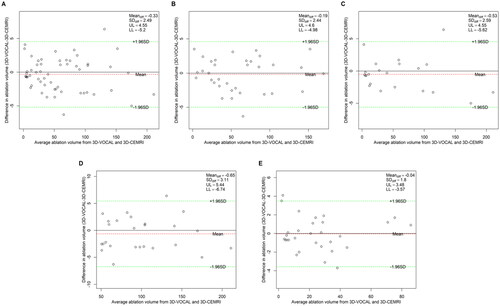
Table 1. Reliability and agreement between the two ultrasonic measurement methods and 3D-CEMRI.
Table 2. Comparison of NPV values obtained by the three measurement methods.
Figure 5. Bland–Altman plot of the inter-observer agreement for NPV measurements obtained via 2D-CEUS. (A) All patients; (B) patients with UM; (C) patients with AM; (D) patients with maximum diameter ≥5 cm; (E) patients with maximum diameter <5 cm.
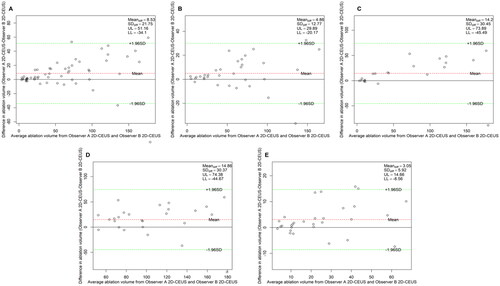
Figure 6. Bland–Altman plot of the inter-observer agreement for NPV measurements obtained via 3D-VOCAL. (A) All patients; (B) patients with UM; (C) patients with AM; (D) patients with maximum diameter ≥5 cm; (E) patients with maximum diameter <5 cm.
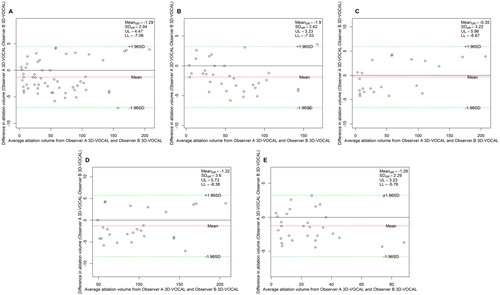
Figure 7. Bland–Altman plot of the inter-observer agreement for NPV measurements obtained via 3D-CEMRI. (A) All patients; (B) patients with UM; (C) patients with AM; (D) patients with maximum diameter ≥5 cm; (E) patients with maximum diameter <5 cm.
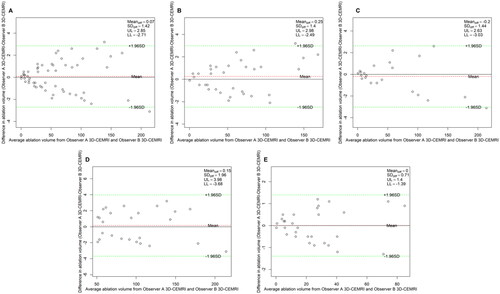
Table 3. Inter-observer agreement in the three measurement methods.
Figure 8. Bland–Altman plot of the intra-observer agreement for NPV measurements obtained via 2D-CEUS. (A) All patients; (B) patients with UM; (C) patients with AM; (D) patients with maximum diameter ≥5 cm; (E), patients with maximum diameter <5 cm.
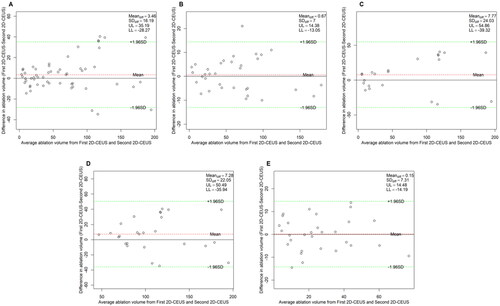
Figure 9. Bland–Altman plot of the intra-observer agreement for NPV measurements obtained via 3D-VOCAL. (A) All patients; (B) patients with UM; (C) patients with AM; (D) patients with maximum diameter ≥5 cm; (E) patients with maximum diameter <5 cm.
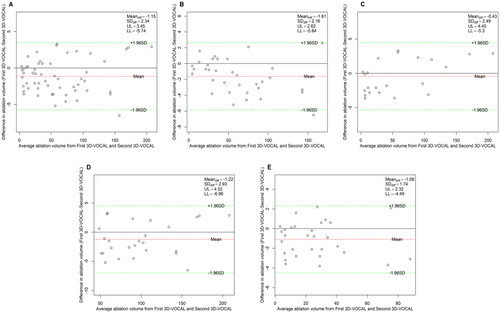
Figure 10. Bland–Altman plot of intra-observer agreement for NPV measurements obtained via 3D-CEMRI. (A) All patients; (B) patients with UM; (C) patients with AM; (D) patients with maximum diameter ≥5 cm; (E) patients with maximum diameter <5 cm.
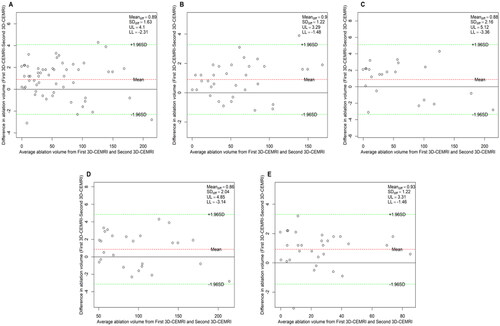
Table 4. Intra-observer agreement of the three measurement methods.