
Figures & data
Figure 1. Flow-chart of patient inclusion process.
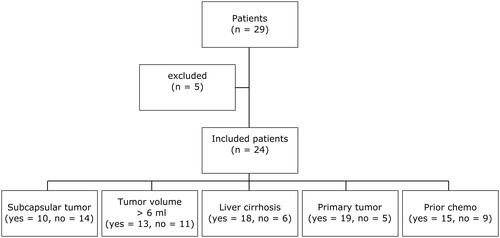
Table 1. Demographic data of patients included for further evaluation of tissue shrinkage after CT-guided MWA.
Figure 2. Schematic description of the postprocessing steps for evaluation of tissue shrinkage. 1: Export of pre- and post-interventional CT images. 2: Semi-automatic whole liver (yellow color-coded) and tumor (blue color-coded) segmentation. 3: Image registration. 4: Application of a postprocessing algorithm to quantify voxel wise the deformation volume of the liver tissue. 5: Calculation of JD maps in three defined anatomic regions (green zone = ablated tumor; red zone = 5cm tumor perimeter; blue zone = whole liver). 6: Evaluation of tissue shrinkage considering different patient and tumor settings.
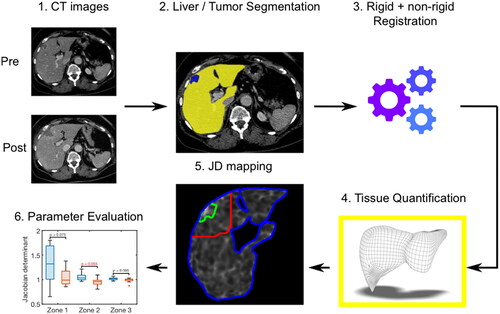
Figure 3. Exemplary registration analysis. A 43-year-old female patient with a subcapsular located metastasis of a neuroendocrine cervix carcinoma is shown (blue arrow). The bifurcation of the portal vein was defined as landmark and marked in the pre-interventional (A), in the registered (B) and in the post-interventional CT dataset (C) (red cross). The landmark distance between pre- and post-interventional CT images was 10.3 mm and, as expected, the landmark distance between pre- and registered post-interventional CT image decreased, in this patient up to 2.0 mm.
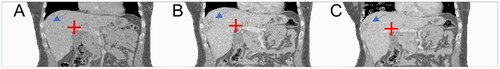
Table 2. Results of different patient´s preconditions.
Figure 4. Exemplary results of two patients are demonstrated. (A) Pre- and post-interventional CT images of a 34-year-old female patient with a non-subcapsular located liver metastasis in segment 8 (green arrow) with 6.5 ml tumor volume with regional tissue alterations in zone 1 (green line) of −2.5 %, tissue shrinkage in zone 2 (red line) of +4.7% and similar tissue formation in the whole liver (blue line). (B) Pre- and post-interventional CT images of a 64-year-old female patient with a subcapsular liver metastases in segment 4 (green arrow) with 6.9 ml tumor volume with regional tissue alterations in zone 1 (green line) of +0.9%, +1.6 % in zone 2 (red line) and −0.1 % in the whole liver (blue line).
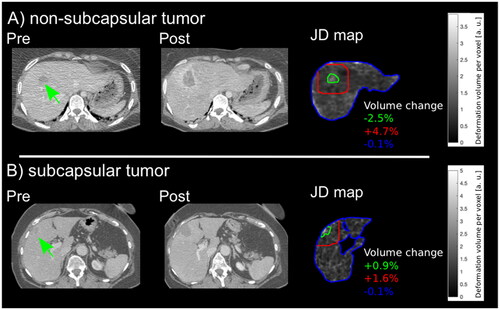
Figure 5. Results of volume changes for all subgroups (A–E) in the ablated tumor, 5-cm perimeter and the whole liver, respectively, are demonstrated. Hepatic tissue volume changes were compared depending on different clinically preconditions including tumor location (subcapsular vs. non-subcapsular, (A), tumor volume (6/<6 ml, B), presence of cirrhosis (yes vs. no, C), tumor entity (primary vs. secondary, D), history of chemotherapy (yes vs. no, E).
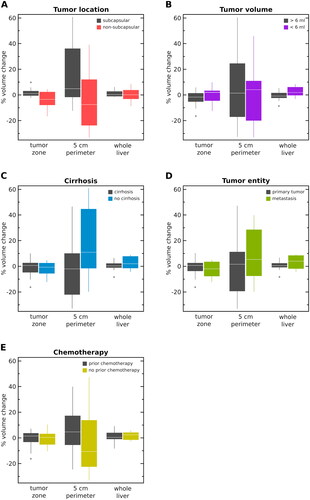
Table 3. Percental tissue volume changes post-MWA of each subgroup are shown.
Table 4. Results of the post hoc power calculation [Citation26].