
Figures & data
Figure 1. Experimental setup for the microwave ablation of swines.
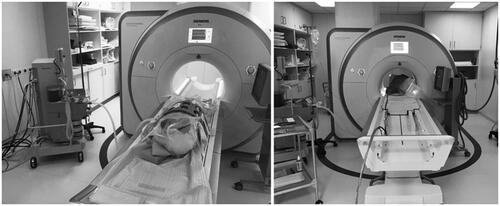
Table 1. Imaging protocol of MR-guided microwave ablation.
Table 2. Animal population, deposited energy and start and end temperature of the MWA, temperature accuracy and dice coefficients, sensitivities and false positive rate of PRF-based thermometry, susceptibility differences between liver and gas of all animals and all ablation procedures.
Figure 2. Formation of gas bubbles and tissue carbonization during MWA lead to an development of the signal void around the center of the ablation zone in imaging of MR-thermometry. The red lines indicate the contours of the signal void found by the semi-automatic segmentation approach. In addition, the time after starting of the ablation procedure (duration 720 s) is given.
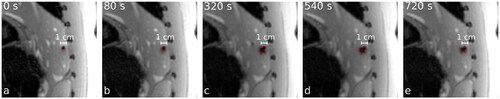
Figure 3. Exemplary liver ablation (swine 1, first ablation) with ablation zone determined by T1w-CE imaging (red line in (a)) and segmented area of signal void in MR-thermometry (black line in (d)). The resulting temperature map at the end of ablation (b and e) and corresponding time-dependent temperature curves (c, f) at four different positions (1: red, 2: green, 3: yellow and 4: blue dot) without (first row) and with (second row) susceptibility correction are shown.
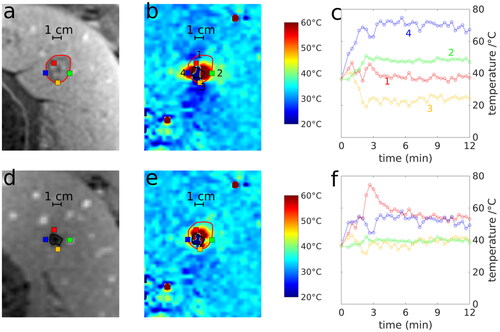
Figure 4. Comparison of the predicted ablation zone assessed by T1w-CE, uncorrected (raw) and susceptibility corrected (corr) thermometry with histopathology (first row) and T1w-CE as reference (green area: intersection, yellow area: false negative, red area: false positive). Dice coefficients (Dice), sensitivities (Sen) and False Positive Rate (FPR) are given related to histopathology (first column) and T1w-CE (second column). Correspondingly, H&E and TUNEL staining as well as the image of T1w-CE are shown.
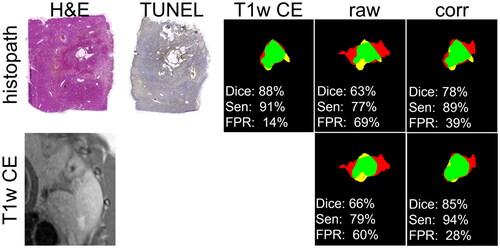
Figure 5. Dice coefficients, sensitivity and FPR of the ablation zone provided by MR-thermometry without and with susceptibility correction. Red lines with blue boxes represent group median with interquartile range for the corresponding data (black dots). p-Values of the Wilcoxon signed-rank test are shown.
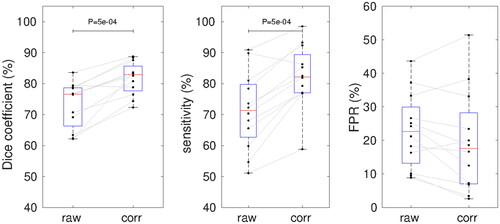
Figure 6. Bland–Altman plot of the area (first column), major axis and minor axis length (second and third column) of uncorrected (first row) and susceptibility corrected (second row) MR-thermometry in comparison to T1w post-ablation contrast-enhanced (P-C) MR-imaging.
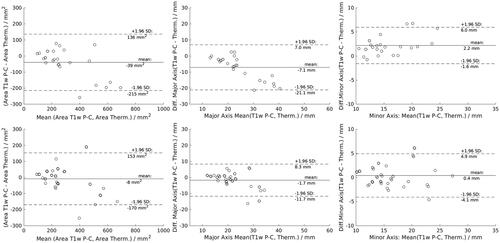
Table 3. Median area, major and minor axis length of the ablation zones depending on the susceptibility correction.
Table 4. p-Values of Wilcoxon signed-rank test comparing area, major and minor axis length of the ablation zones assessed by raw and susceptibility corrected MR-thermometry with T1w-CE MR-imaging.