
Figures & data
Figure 1. The in-house developed AMC-4/8 system (left), which can be used as a single ring of four antennas (AMC-4) or two rings of eight antennas (AMC-8) and the Alba 4D (right; Medlogix®, Rome, Italy) locoregional hyperthermia systems.
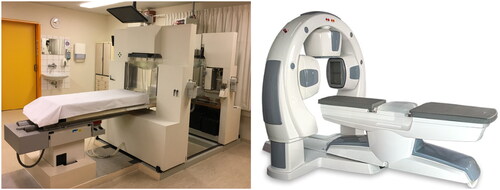
Table 1. Overview of treatments per patient with the AMC-4 (grey) and Alba 4D (blue) locoregional hyperthermia systems.
Figure 2. The applied power per patient for each hyperthermia treatment session with the Alba 4D (blue) and the AMC-4 (grey) locoregional hyperthermia systems.
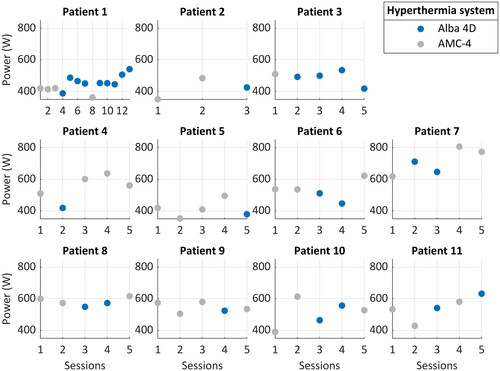
Figure 3. The achieved intraluminal T90 for each patient during the treatment sessions. Treatments with the Alba 4D are depicted in blue and treatments with the AMC-4 locoregional hyperthermia system in grey.
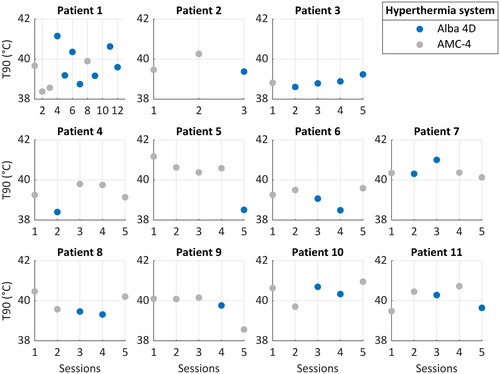
Figure 4. The applied power versus the achieved intraluminal T90. Each patient has a unique symbol; the color indicates the locoregional hyperthermia system: Alba 4D in blue, AMC-4 in grey. For both devices the mean applied power and achieved T90 are displayed with dashed lines.
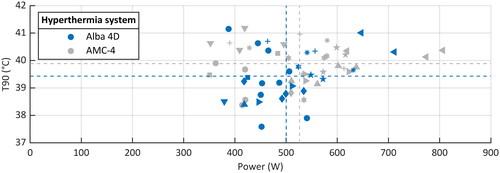
Table 2. Treatment characteristics presented as mean ± SD or median (range).
Table 3. Advantages and disadvantages mentioned by patients and staff members.