
Figures & data
Figure 1. Flowchart of patient recruitment with inclusion and exclusion criteria (a, b).
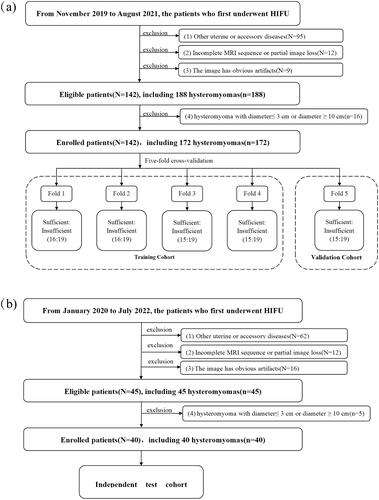
Figure 2. Flowchart showing the process for the development of radiomics.
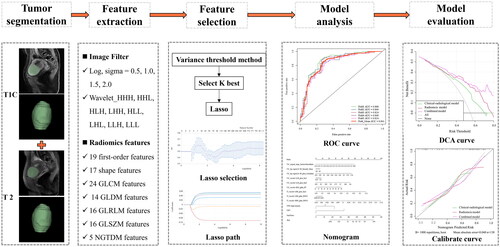
Table 1. Clinical–radiological features of patients in the training, validation and independent test datasets.
Table 2. Univariate and multivariate analyses results of clinical–radiological features.
Figure 3. ROC curves of clinical–radiological models, radiomics models and combined models in the training (a, c, e) and validation (b, d, f) cohorts.
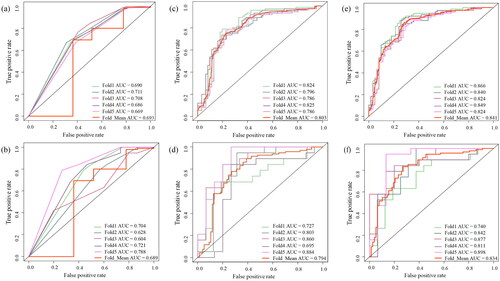
Table 3. Performance of clinical–radiological, radiomics and combined models in the training and validation cohorts.
Table 4. Comparison of models in the training and validation cohorts.
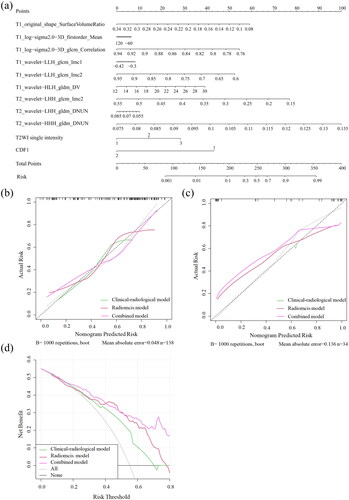
Figure 4. The combined nomogram for predicting the efficacy of HIFU for hysteromyoma (a). The developed nomogram based on the combined model to predict the risk of insufficient HIFU ablation. T2WI signal intensity: 1, hyperintensity; 2, isointensity; 3, hypointensity; CDFI signal: 1, small amount; 2, slightly abundant. Calibration curves for the nomogram in the training and validation cohorts (b, c). The black dashed line represents the ideal prediction, and the green, red and purple lines represent the predictive ability of clinical–radiological models, radiomics models and combined models. The closer they fit to the dashed green line, the greater the prediction accuracy of the model. Decision curve analysis for the nomogram (d). The black line represents the net benefit of assuming no hysteromyoma patients receive HIFU ablation. The grey line is the net benefit of assuming that all hysteromyoma patients receive HIFU ablation. The green line, red line and purple line represent the expected net benefit of predicting stroke outcome using the clinical–radiological models, radiomics models and combined models, respectively.
Supplementary Tables
Download PDF (156.9 KB)Data availability statement
The data used to support the findings of this study are available from the corresponding author upon request