Figures & data
Figure 1. (a) Multi-slice and real-time reconstruction pipeline for multi-baseline PRFS acquisition. Once MRI data are obtained, the data are sorted by a slice number, a navigator position, and a respiratory phase (inhale/exhale). (b) Interleaved acquisition sequence series and (c) an example of a multi-baseline approach: five baselines at each respiration phase and 10 different reference images are recorded for PRFS calculations.
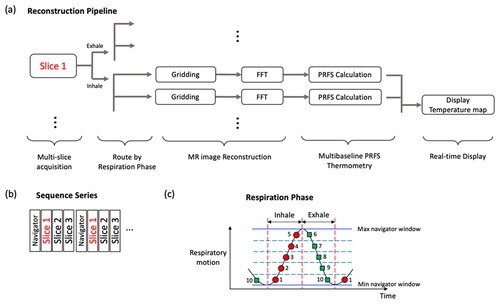
Figure 2. MR magnitude images of (a) virtual simulation phantom and (b) respiratory motion phantom in the MRI scanner. An ultrasound transducer was set up to heat a tissue-mimicking phantom, while the motion simulator can only move the phantom. The red arrow indicates the motion direction induced by the respiratory motion.
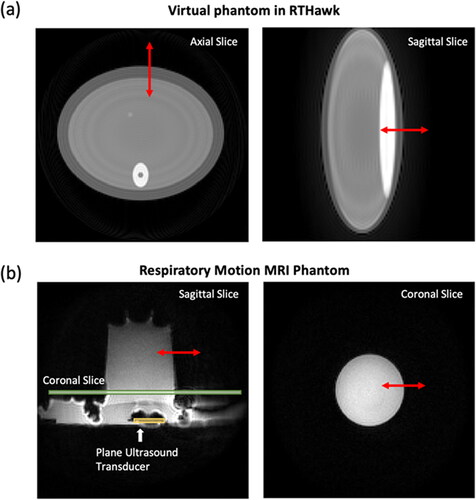
Table 1. Summary of accuracy and precision determinations for MR thermometry for all experiments in simulation, phantom and healthy volunteers.
Figure 3. (a) Comparison of PRFS MR thermometry between a single baseline and multiple baselines (30 baselines) in the virtual phantom simulation. Temperature maps from multi-baseline PRFS acquisition show stable and homogeneous temperature distributions. (b,c) Bar graphs show temperature accuracy and precision according to baseline numbers and respiratory rates. In (b), respiratory rates are 12 cycles/min, and the temperature accuracy and precision in a single baseline acquisition are measured at 0.44 °C and 0.38 °C, respectively. In (c), 25 baselines are used for the PRFS reconstruction, except for no motion case (single baseline), and the temperature accuracy and precision without motion are measured at 0.0187 °C and 0.0185 °C.
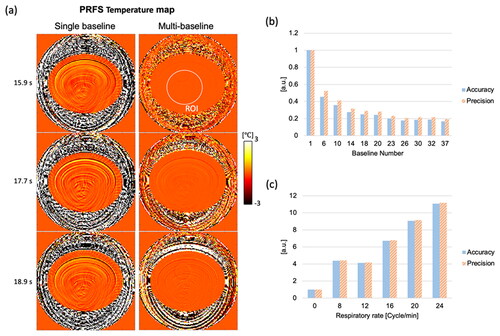
Figure 4. Time sequence of PRFS temperature maps obtained by multi-slice acquisition during the respiratory phantom experiments without ultrasound heating. A single baseline acquisition shows motion-induced artifacts in the PRFS maps, while a multi-baseline acquisition provides stable and homogeneous temperature distributions for a breathing cycle.
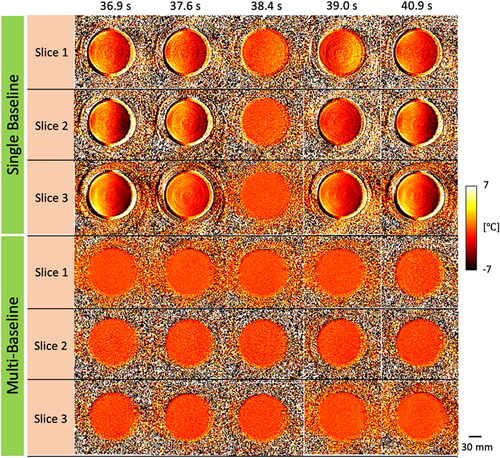
Figure 5. Time-dependent profiles from PRFS temperature maps in the respiratory phantom experiment without heating. The profiles are plotted with averaged values within an ROI (red circle, left). The red dashed box indicates a time point for temperature maps shown for slices 1, 2 and 3 in .
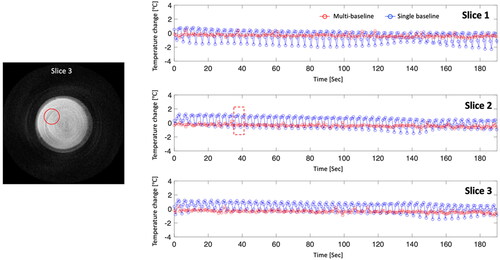
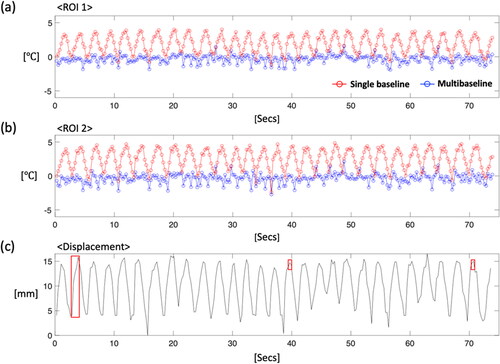
Figure 6. The results of the respiratory phantom experiment with ultrasound heating, showing PRFS temperature maps with (a) a single- and (b) a multi-baseline acquisition. More uniform heating patterns are observed in temperature maps from the multi-baseline acquisition. The profiles are plotted with averaged values within ROI 1 (c) and 2 (d), which are within and outside the heated region, respectively. In displacement records (e), the red box indicates a time point for temperature maps.
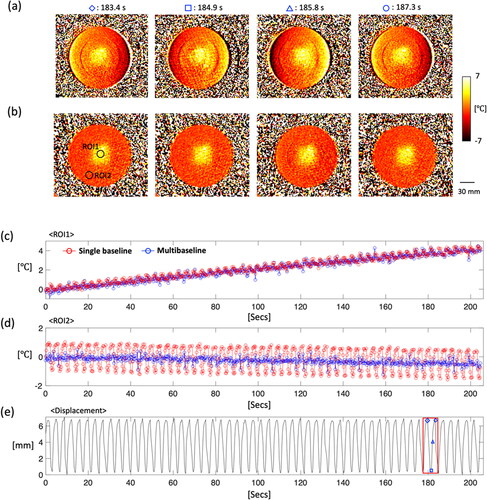
Figure 7. The result of healthy volunteer experiments without heating (volunteer #1). (a) A coronal slice is acquired and shows the left and right kidney organs which are indicated with blue dashed lines. PRFS temperature maps show that a (c) multi-baseline PRFS reconstruction allows stable and homogeneous temperature measurements, compared to a (b) single baseline (see Supporting Material Video S1). A pencil beam navigator is placed at the boundary of the diaphragm to measure a respiratory motion position.
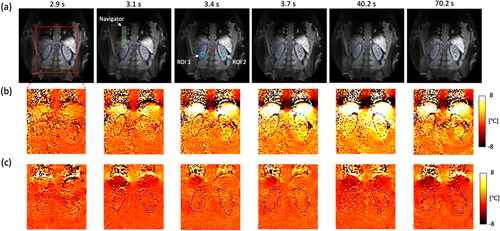
Figure 8. Time-dependent profiles within ROI 1 (a, left kidney) and ROI 2 (b, right kidney) (volunteer #1). ROIs are shown with cyan circles in . A single baseline reconstruction shows periodic patterns corresponding to (c) the respiratory motion, while a multi-baseline acquisition allows stable temperature measurements. The red box indicates time points for temperature maps shown in .