
Figures & data
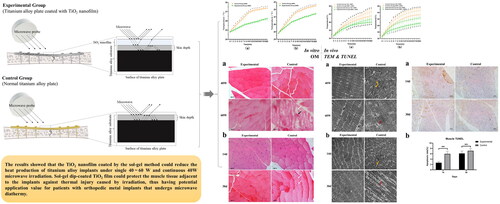
Figure 1. Microwave irradiation and in vitro temperature measurement.
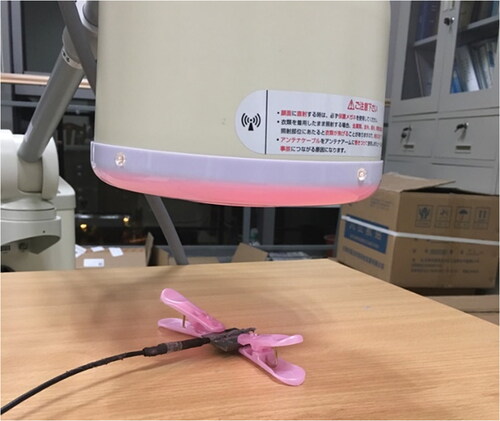
Figure 2. Postoperative X-ray to determine the position of internal fixation.
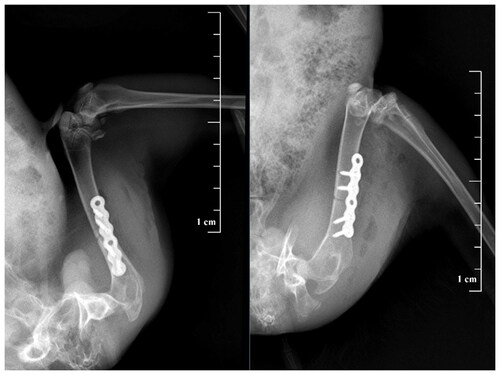
Figure 3. Femurs of New Zealand rabbits with TAI irradiated by microwave and temperature measured.
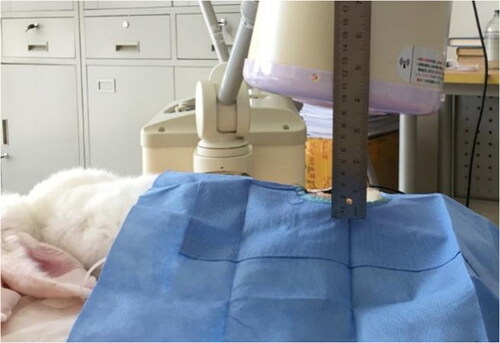
Figure 4. Temperature changes of the Experimental Group and the Control Group after 2450 MHz microwave irradiation in vitro. Intra-group comparisons showed that the rate of temperature rise was faster when samples were irradiated with 60 W microwave compared to 40 W microwave, and the rate of temperature rise slowed down over time. The difference between the Experimental Group and the Control Group was statistically significant from the second minute after 40 W microwave irradiation (a) and from the third minute after 60 W microwave irradiation (b). *p < .05.
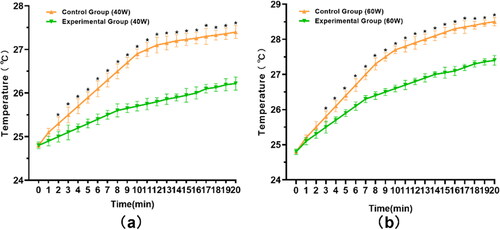
Figure 5. Temperature changes of TAI and deep muscle tissue under 40 W and 60 W microwave irradiation. (a) When the microwave power was 40 W, compared with the Control Group, the temperature of TAI in the Experimental Group began to show a statistical difference from the fourth minute (p < .05). The temperature of deep muscle was statistically different from the seventh minute (p < .05). (b) When exposed to a 60 W microwave. compared with the Control Group, the temperature of TAI in the Experimental Group began to show a significant difference from the fourth minute (p < .05). There was a significant difference in deep muscle temperature from the third minute (p < .05). *Experimental Group-TAI vs. Experimental Group-DMU, #Control Group-TAI vs. Control Group-DMU, &Experimental Group-DMU vs. Control Group-DMU, δExperimental Group-TAI vs. Control Group-TAI. TAI: titanium alloy implant, DMU: deep muscle.
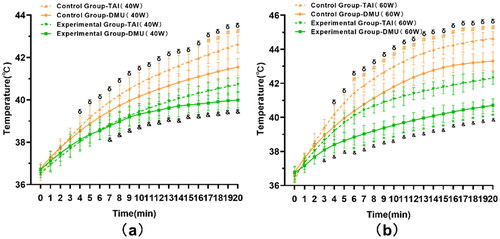
Figure 6. Histopathological changes of skeletal muscle adjacent to implants after 40 W and 60 W single microwave irradiation and continuous 40 W microwave irradiation (optical microscope). Black arrow: intermuscular bleeding, white arrow: myofibril disruption (a) and muscle fiber disorder (b).
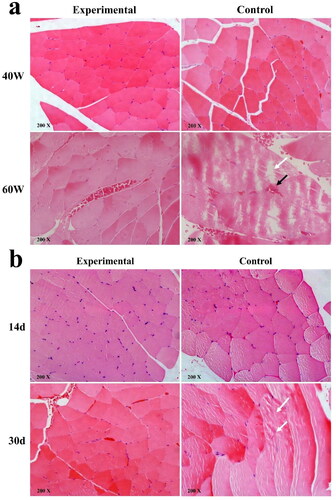
Figure 7. Histopathological changes of skeletal muscle adjacent to the implant after single microwave irradiation at 40 W and 60 W and continuous microwave irradiation at 40 W (transmission electron microscope). Yellow arrow: increased swelling of mitochondria; red arrow: disorder of sarcomere.
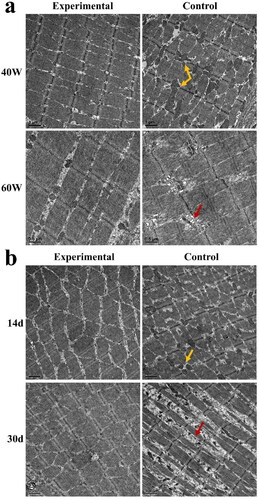
Figure 8. Comparison of apoptosis rate of muscle adjacent to the implant after continuous daily irradiation with 40 W microwave. (a) Light microscopic observation of muscle cell apoptosis. (b) Analysis of muscle cell apoptosis rate. **Statistical differences between the two groups were observed.
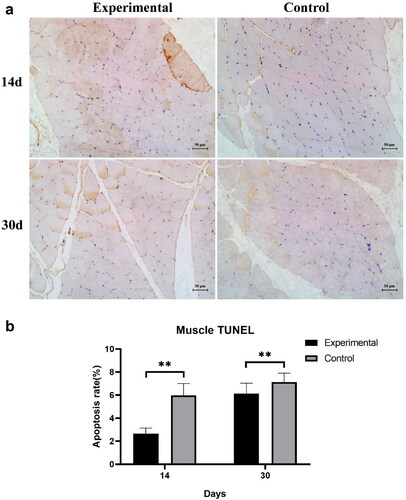
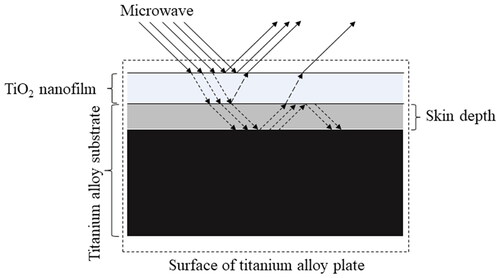
Figure 9. Possible mechanism of the thermal barrier effect of TiO2 nanofilm. This is the conjectured pattern diagram that does not represent the true sample size and energy conversion mechanism.
Data availability statement
The data that support the findings of this study are available from the corresponding author Yiming Xu upon reasonable request.