
Figures & data
Figure 1. Kaplan–Meier survival curves for OS (A) and CSS (B) in inoperable patients with stage III NSCLC. OS: overall survival; CSS: cancer-specific survival; NSCLC: non-small cell lung cancer.
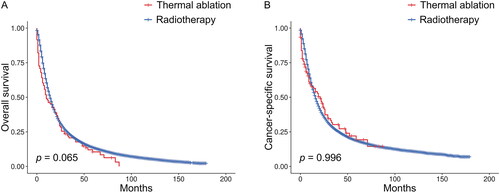
Table 1. Characteristics of patients with stage III NSCLC before and after PSM, n (%).
Table 2. Univariable and multivariable analyses of OS and CSS in stage III NSCLC patients receiving radiotherapy or thermal ablation before PSM, n (%).
Figure 2. Kaplan–Meier survival curves for OS (A) and CSS (B) in inoperable patients with stage III NSCLC after PSM. OS: overall survival; CSS: cancer-specific survival; NSCLC: non-small cell lung cancer; PSM: propensity score matching.
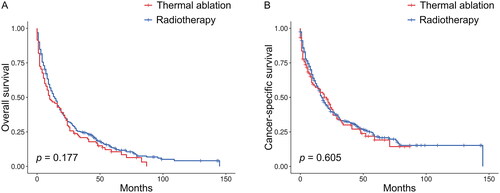
Figure 3. Kaplan–Meier survival curves for OS between the thermal ablation and radiotherapy groups when age was <65 years (A), 65–74 years (B), 75–84 years (C), or ≥85 years (D) before PSM. OS: overall survival; PSM: propensity score matching.
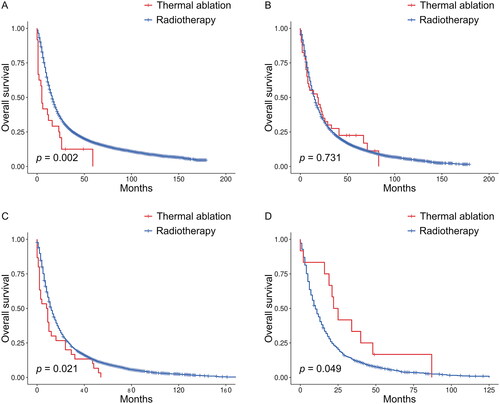
Figure 4. Kaplan–Meier survival curves for OS between the thermal ablation and radiotherapy groups when age was <65 years (A), 65–74 years (B), 75–84 years (C), or ≥85 years (D) after PSM. OS: overall survival; PSM: propensity score matching.
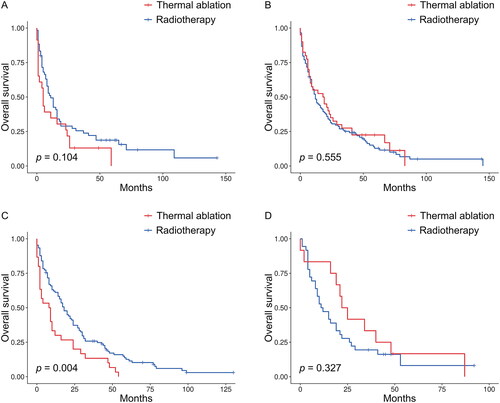
Figure 5. Kaplan–Meier survival curves between the thermal ablation and radiotherapy groups when TNM substage was IIIA (A, B) or IIIB (C, D) before PSM. PSM: propensity score matching.
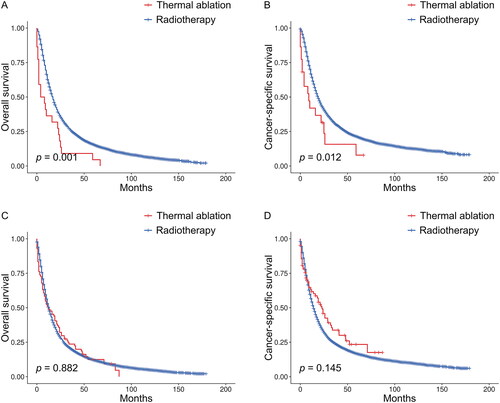
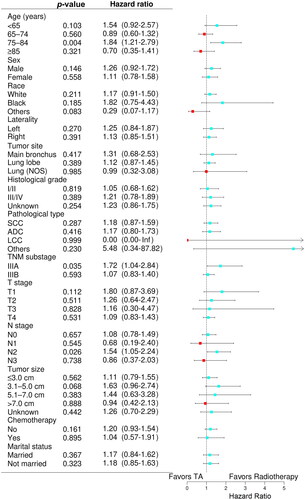
Figure 6. Forest plot depicting subgroup analysis of OS between the TA and radiotherapy groups after PSM. NOS: not otherwise specified; SCC: squamous cell carcinoma; ADC: adenocarcinoma; LCC: large cell carcinoma; Inf: infinity; OS: overall survival; TA: thermal ablation; PSM: propensity score matching.
Supplemental Material
Download PDF (1,004.2 KB)Data availability statement
Publicly available datasets were analyzed in this study. The data can be found here: https://seer.cancer.gov/.