Figures & data
Figure 1. Animal study design for the fecal microbial transplant (FMT) based hyperthermia study experiment carried out for 18 days where male and female rats were randomly divided into 4 groups (female and male controls and FMT groups). The male and female FMT groups participated first in ABX (Day 9) treatment followed by FMT treatment (Day 18), while the remaining two groups served as controls without any treatments until final day (Day 18) where all 4 groups were treated with MA (10 mg/kg, sc). ABX was carried out for 5 days (starting Day 2–6, followed by washout period of 3 days) and bidirectional FMT process (between male and female FMT groups) in two rounds of 3 days (Day 9–11 and Day 15–17 with gap of 3 days) via oral gavage. Feces were collected and pooled for all 4 groups at 4 time points (maroon dots) on Day 1(baseline), Day 9 (after ABX treatment) and Day 18 (pre- and post-MA treatment). Figure made with BioRender.
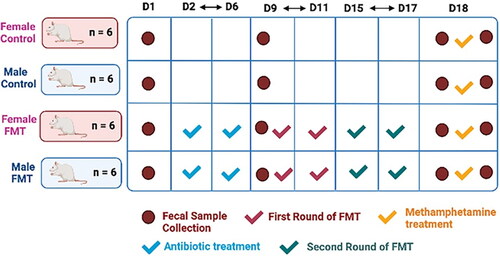
Figure 2. Core body temperature (Tc) change upon MA (10 mg/kg sc) treatment in male and female groups. (A) The difference from baseline calculations for both male and female groups. (B) maximum temperature change following MA administration. Each value represents the mean ± SEM, n = 6. * indicates significant differences between MA-treated female groups (control and FMT-treated) at 30, 60- and 90-min time points and the male treatment groups (control and FMT-treated) at the 30 min time point (p < 0.05).
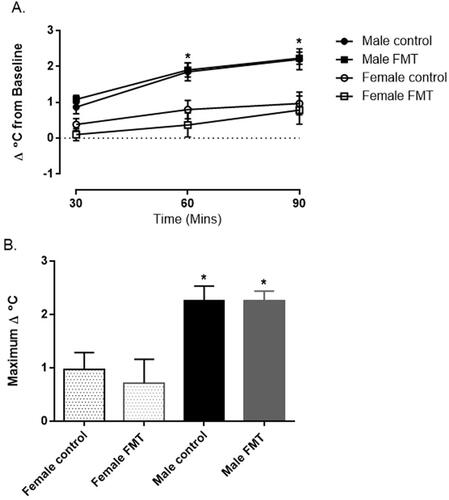
Figure 3. NE levels measurements in plasma samples at 90-min time point. All treatment groups (control, ABX-FMT-treated) showed comparable levels of NE 90 min after MA (10 mg/kg, sc) administration. Each value represents the mean ± SEM, n = 6. * indicates significant differences between treatment groups (p < 0.05).
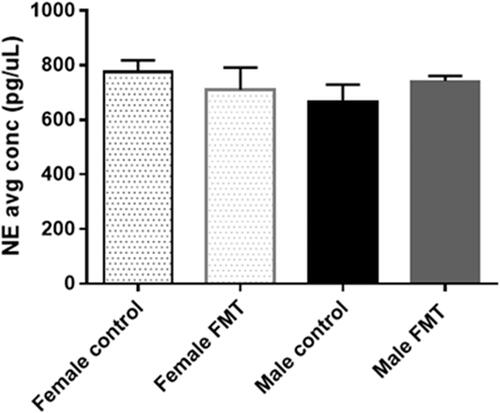
Figure 4. MA and amphetamine levels assessment in plasma in ABX-FMT-treated groups (Two-tailed t-test within same drug-assessed groups). * indicates significant differences between treatment groups. Each value represents the mean ± SEM, n = 6. * indicates significant differences between treatment groups (p < 0.05).
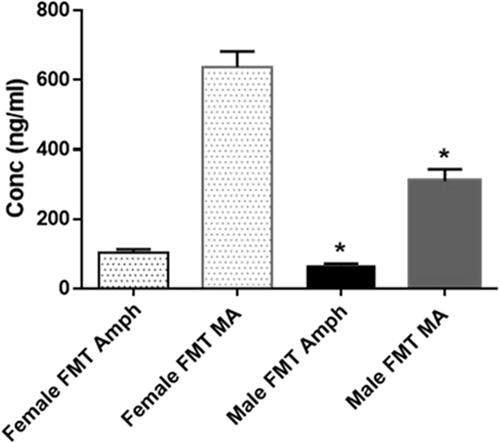
Figure 5. Bray Curtis dissimilarity based Principal Coordinates Analysis (PCoA) showing β-diversity for a) Control male and female groups and b) FMT groups at 4 different time points: Day 1(D1, baseline), Day 9 (D9, after ABX treatment) and on Day18 (D18, pre- and post MA treatment). In figure b, Cluster I and II represent male and female samples from Day 1 and 9, Cluster III and IV for female and male groups on Day 18 (pre- and post-MA treatments).
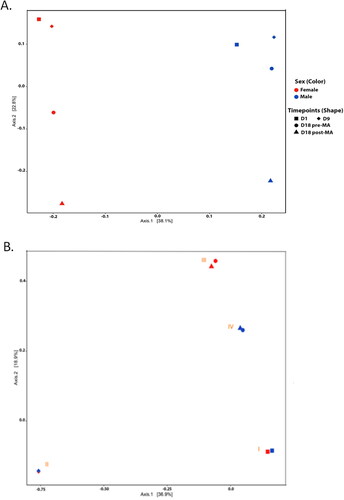
Figure 6. The α-diversity plots showing a) ASV richness and b) Shannon Diversity Index plotted for control vs FMT groups for both male and female groups at 4 different timepoints.
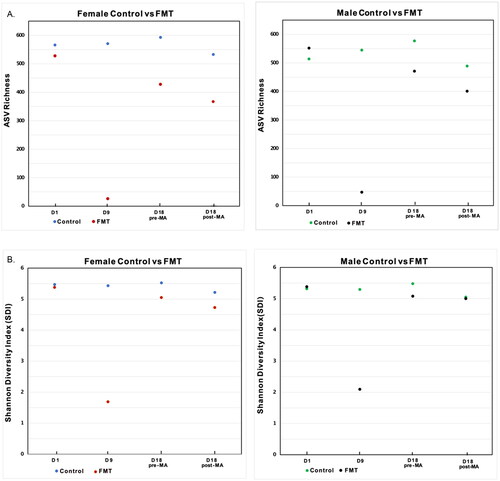
Figure 7. Figure showing relative abundance (%) based stacked bar plot of the bacterial phyla (>0.1%) in (a) control and (b) FMT groups for both male and female groups at 4 different timepoints.
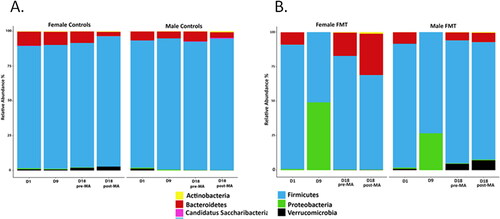
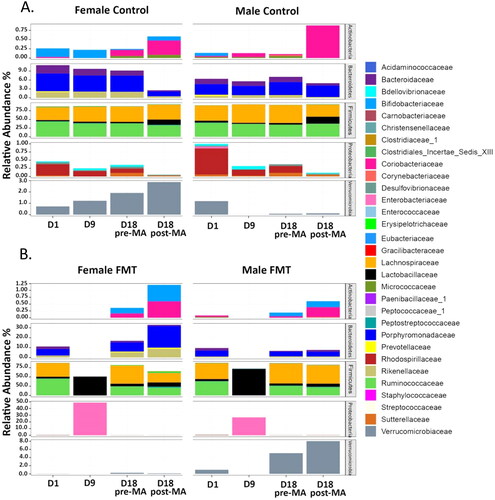
Figure 8. Figure showing relative abundance (%) based stacked bar plot of the bacterial families (>0.1%) in (a) control and (b) FMT groups for both male and female groups at 4 different timepoints.