
Figures & data
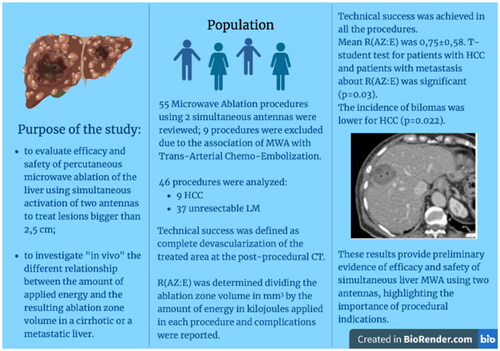
Figure 1. Flowchart illustrates number of patients treated with MWA, excluded patients, and subgroup population.
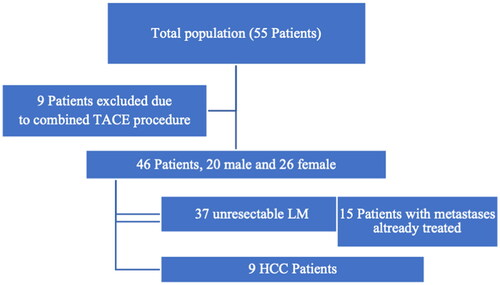
Table 1. Distribution of discrete variables of the patients’ features (age, sex); tumor histology, location in liver segments, size, and volume of both lesions and ablation zones.
Figure 2. Roundness index distribution for HCC and LM before and after ablation.
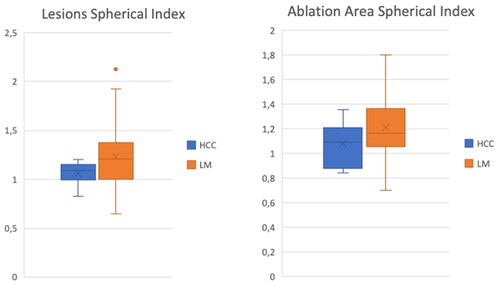
Figure 3. R(AZ:E) distribution between HCC (0) and LM (1).
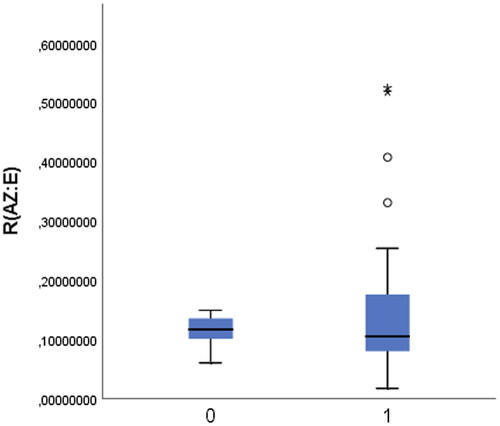
Figure 4. R(AZ:E) distribution in patients retreated (1) and patients who were not retreated (0).
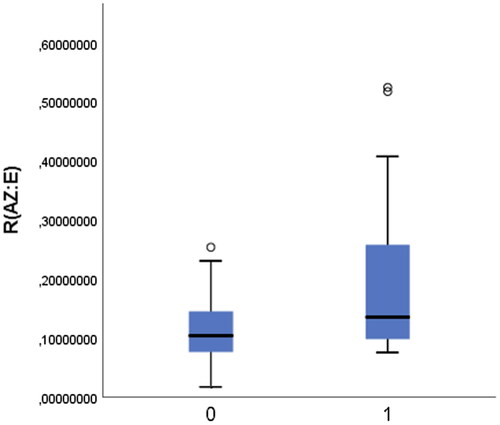
Figure 5. 78yo with liver metastasis of renal cell carcinoma treated with two microwave antennas. (a, b) US images highlighting the distance between the two probes and the hyperechoic bubbles during the ablation (c) Contrast-enhanced US exam displaying the complete devascularization of the lesion at the end of the procedure. (d) Unenhanced, (e) arterial and (f) portal CT scan images performed at the end of the procedure showing a subcapsular hemorrhage (arrow). (g) Cauterization of hepatic capsular access at 90° for 3 min was performed (circle). (h) Good local bleeding control at the CT scan after 48 h.
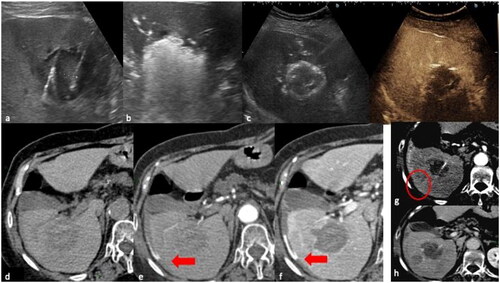
Figure 6. 70 yo with liver metastasis of pancreas adenocarcinoma, treated with MWA. (a) portal phase CT scan, coronal plane; (b) intraprocedural ecographic image of the lesion (c) portal phase coronal and axial CT scan showing necrosis in the ablated zone, without evidence of residual disease; small air bubbles (arrow) are present, a common finding after the procedure, which normally disappear during follow-up. (d) portal phase MR performed one month after the ablation revealing an asymptomatic biloma; (e) US examination of the abdomen was performed 3 months after the ablation due to fever, revealing an infected biloma, treated with a percutaneous drainage tube (f, g, h).
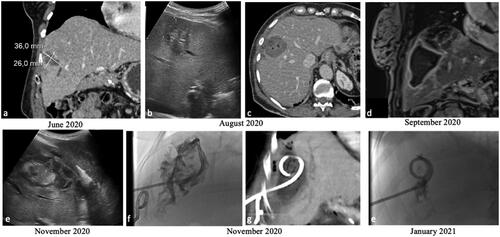
Table 2. mRECIST and RECIST 1.1 categorization at 1,6 months and then 1,2,3 years for HCC and for LM, with percentage of Complete Response (CR), Partial Response (PR) and Progression Disease (PD) at each time point.
Figure 7. 74 year old woman, with liver recurrence of breast cancer of 36 x 36 mm(a). (b) The lesion was treated with simultaneous activation of two PR antennas; single treatment with a power of 65 W for 10 min was performed. (c, d, e) MIP and MRP reconstructions of the immediate post-procedural CT showing an ellipsoid ablative zone of 60 x 43 x60 mm with complete devascularization.
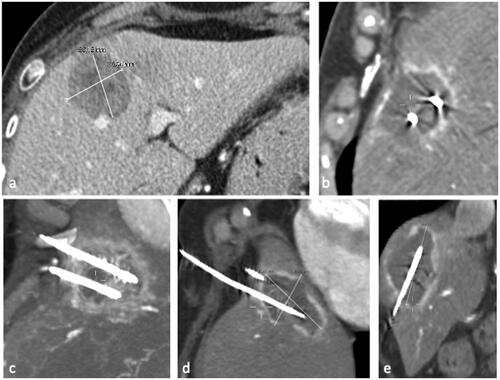
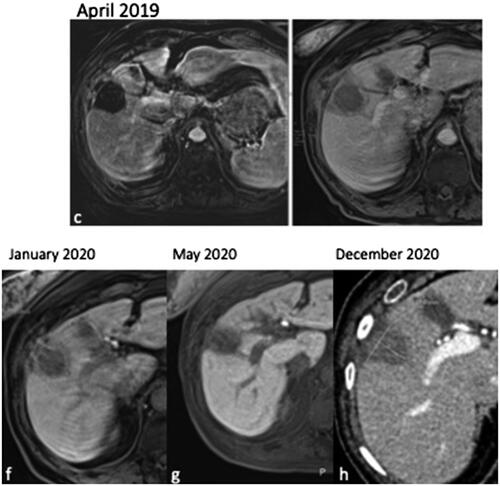
Figure 8. Evolution of the ablation zone from the previous case, showing no evidence of recurrence 10 months after the ablation.
Data availability statement
Not applicable.