
Figures & data
Table 1. The list of primers.
Figure 1. Cryo produced transient growth inhibition of distant tumors outside the ablation zone. A. The mouse bilateral in situ mammary tumor model was successfully constructed, and the white arrow indicates that the mouse right mammary tumor was treated with Cryo. B. The tumor tissue from the successful model was stained with H&E, and a large number of tumor cells are visible in the field of view. Bars, 50 μm. C. Growth curve of the left unablated tumor. (n = 10).
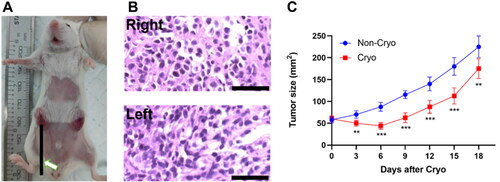
Figure 2. Cryo-induced T-cell infiltration into distant tumors and analysis of their dynamics. Cryo was administered as described in , and the left unablated breast tumor tissue was taken and digested to produce a single cell suspension or used for RNA extraction. A, Representative flow cytometric plots (Rfcp) of CD45+ immune cells in tumor tissue on Day 3 and Day 9 after Cryo (single cell gate). B, Percentage of CD45+ TILs. C, Rfcp of CD4+ and CD8+ T cells (CD45+ gate). D, Percentage of CD8+ TILs. E, Percentage of CD4+ TILs. F, Rfcp of FoxP3+ cells (CD4+ gate). G, Percentage of Treg cells. H, Rfcp of MDSCs. I, Percentage of MDSCs. J, Relative mRNA expression levels of the Th1-type cytokine TNF-α. K, Relative mRNA expression levels of the Th2-type cytokine IL-4. All results are representative of three independent experiments with five mice per group.
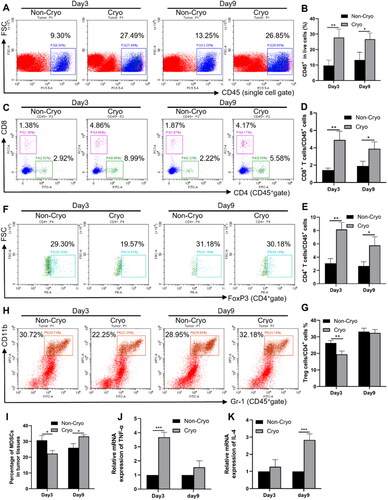
Figure 3. The expression of PD-1/PD-L1 in distant tumor tissues after Cryo treatment. A, The expression distribution of the PDCD1 gene (PD-1) in tumor tissues and corresponding normal tissues adjacent to the tumor. B, The expression distribution of the CD274 gene (PD-L1) in tumor tissues and corresponding normal tissues adjacent to the tumor. C, Paraffin sections of distant tumor tissues from the non-Cryo and Cryo groups were analyzed by IHC for PD-L1 expression. PD-L1 expression was significantly enhanced on Day 9 after Cryo treatment. Bars, 50 μm. D, Representative flow cytometric plots (Rfcp) of PD-1 expression levels on CD8+ T cells in distant tumor tissue on Day 3 and Day 9 after Cryo. E, Percentage of PD-1 expression on CD8+ T cells. F, Rfcp of PD-1 expression levels on CD4+ T cells. G, Percentage of PD-1 expression on CD4+ T cells. H, Rfcp of PD-L1 expression levels on CD11b+Gr1+ cells. I, Percentage of PD-L1 expression on CD11b+Gr1+ cells. J, Relative expression levels of PD-1 mRNA in distant tumor tissues. K, Relative expression levels of PD-L1 mRNA in distant tumor tissues. All results are representative of three independent experiments with five mice per group.
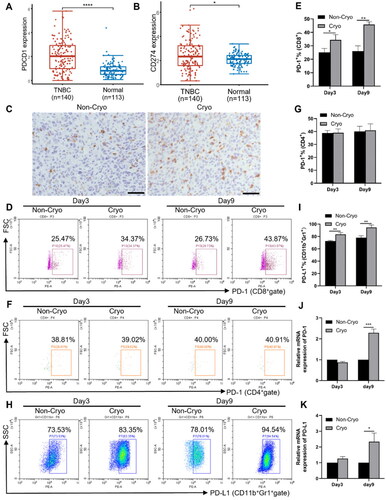
Figure 4. Cryo combined with PD-1 mAb improves tumor immunosuppression and enhances the immune response induced by Cryo. A, Experimental flow chart of the study. B, Plot of distant tumor growth curves for each treatment group (n = 10). C, Survival time profiles of mice in each treatment group (n = 10). D, Representative flow cytometric plots (Rfcp) of CD45+ immune cells in distant tumor tissues of each treatment group. E, Percentage of CD45+ TILs. F, Rfcp of CD4+ and CD8+ T cells (CD45+ gate). G, Percentage of CD8+ TILs. H, Percentage of CD4+ TILs. I, Representative flow cytometric plots of MDSCs. J, Percentage of MDSCs. K, Rfcp of FoxP3+ cells (CD4+ gate). L, Percentage of Treg cells. All results are representative of three independent experiments with five mice per group.
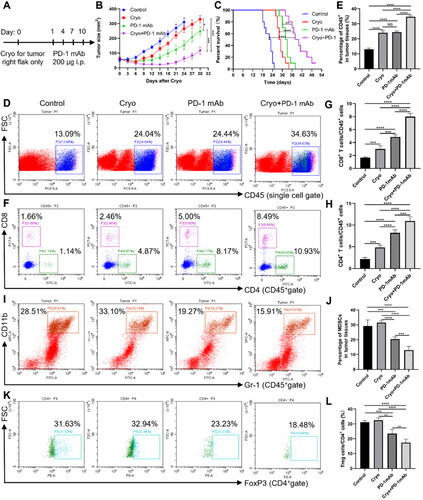
Figure 5. IHC analysis of TILs in distant tumor tissues after treatment with different methods. A, Representative immunohistochemical sections of CD3, CD4 and CD8 T cells in distant tumor tissues of each group after treatment with different methods. Bars, 50 μm. B-D, The corresponding quantification of CD3, CD4 and CD8 T cells in distant tumor tissues of each group after different treatments. Ten visual fields were randomly selected from each slide for analysis. All results are representative of three independent experiments with five mice per group.
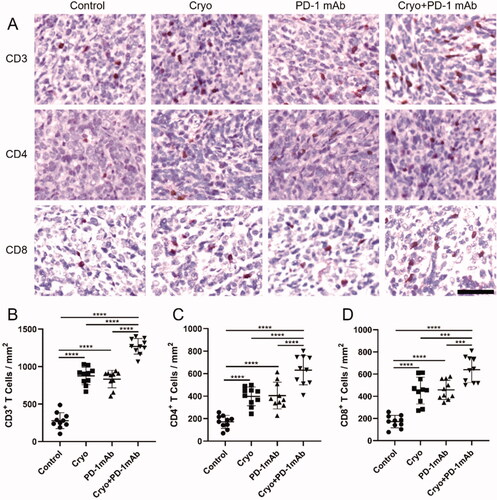
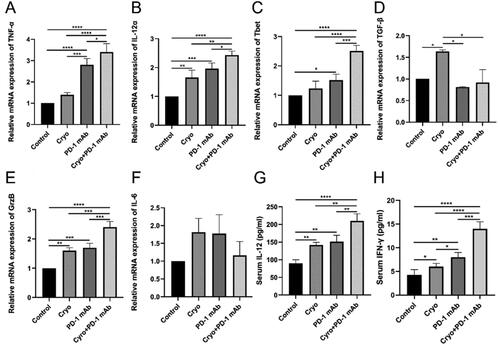
Figure 6. The expression of immune-related cytokines in tumor tissues and serum was measured by qRT–PCR and ELISA, respectively. A-F, The relative mRNA expression levels of TNF-α (A), IL-12α (B), T-bet (C), TGF-β (D), GrzB (E) and IL-6 (F) in tumor tissues of each treatment group. G-H, The expression levels of IL-12 (G) and IFN-γ (H) in the serum of tumor-bearing mice of each treatment group.
Data availability statement
Research data can be obtained from the corresponding authors upon reasonable request.