
Figures & data
Figure 1. PRISMA guided flow diagram of study selection for inclusion in this review and meta-analysis.
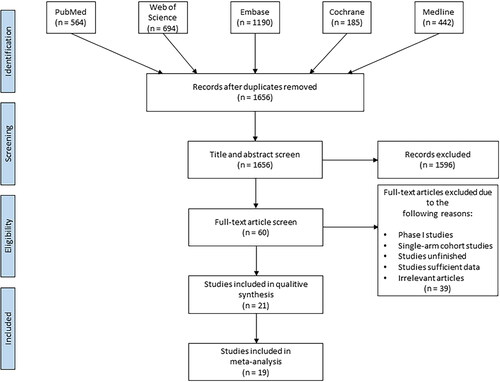
Figure 2. Funnel plot of studies evaluating the publication bias of PFS and OS between HIPEC and No-HIPEC.
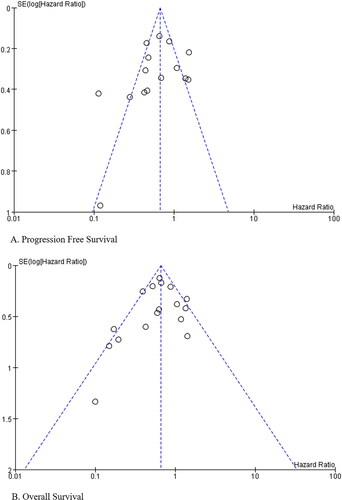
Table 1. The characteristics of the included studies. CRS + HIPEC vs CRS.
Figure 3. Forest plots showing the effect of HIPEC on the survival of EOC.
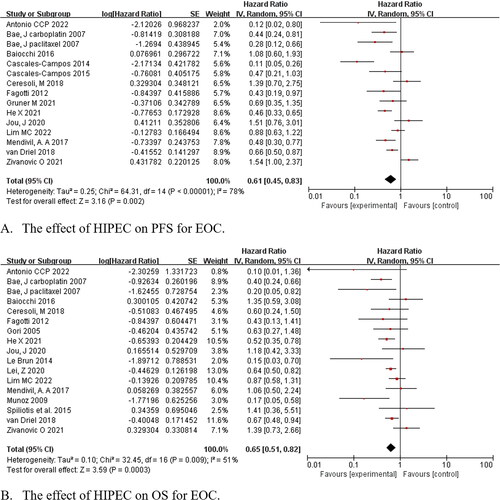

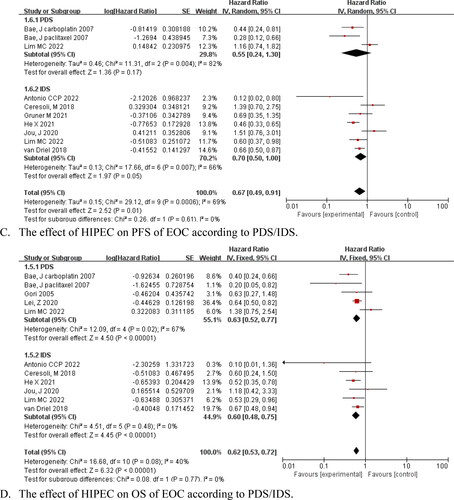
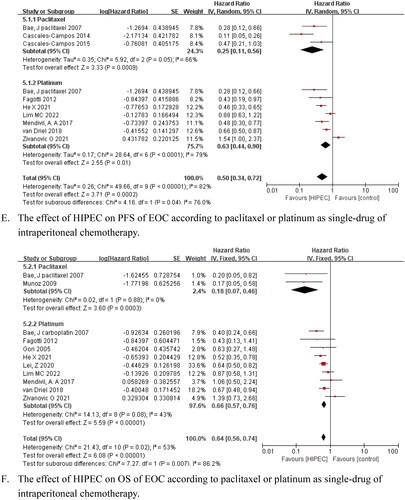
Table 2. Meta-analysis estimates of adverse events between HIPEC and No-HIPEC.
Supplemental material
Supplemental Material
Download PDF (227.5 KB)Data availability statement
Data availability is not applicable to this article as no new data were created or analyzed in this study.