Figures & data
Figure 1. Study design. PBMCs: peripheral blood mononuclear cells; ER: early recurrence; PIFs: peripheral immune factors; RFS: recurrence-free survival.
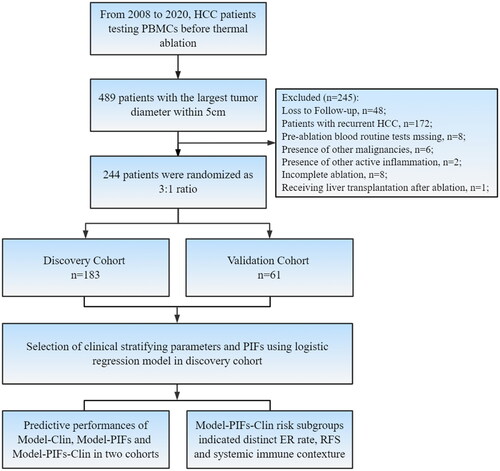
Table 1. Baseline characteristics of each cohort.
Table 2. Univariate and multivariate analyses of baseline clinical and immune characteristics associated with early recurrence.
Figure 2. Performances of ModelClin and ModelPIFs-Clin. (a–b) The AUC and 95%CI of ModelClin and ModelPIFs-Clin for ER prediction in two cohorts. AUC: overall area under the receiver operating characteristic curve; CI: confidence interval; PIFs: peripheral immune factors; ER: early recurrence.
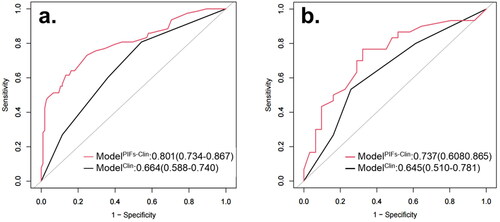
Figure 3. ModelPIFs-Clin risk categories in discovery and validation cohorts. The cumulative incidence of ER in ModelPIFs-Clin-high subgroup compared with ModelPIFs-Clin-low, with 78.0 and 32.2% (p < 0.001) in discovery cohort (a), and and with 54.29 versus 42.31% (p = 0.355) in validation cohort (b). The recurrence free survival (RFS) in ModelPIFs-Clin different subgroups of discovery cohort (c) and validation cohort (d). ns: not significant; *p < 0.05; **p < 0.01; ***p < 0.001; ****p < 0.0001.
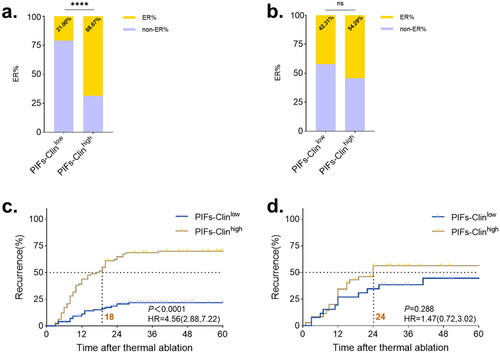
Figure 4. ModelPIFs-Clin reclassified the ER patients who were underestimated by ModelClin as low-risk. (a) Among those ER patients who were underestimated as low-risk by ModelClin, ModelPIFs-Clin could screened out 48.39% (15/31) as high-risk ER patients in discovery cohort. (b) In validation cohort, ModelPIFs-Clin screened out 43.75(7/16) the ER patients who were classified as low-risk by ModelClin.
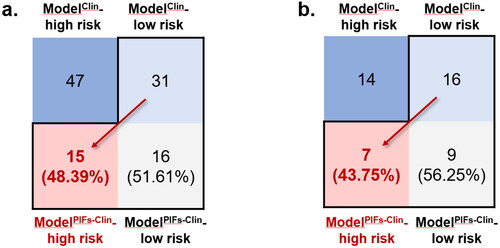
Table 3. Prognostic performance of the models.
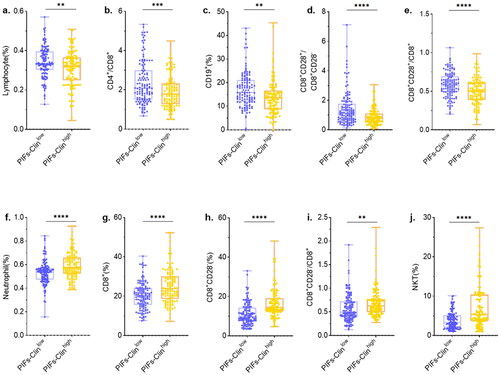
Figure 5. Differences of peripheral immune factors in ModelPIFs-Clin subgroups. According to the optimal cutoff by Youden’s Index, we divided all patients into two subgroups, for whose predictive value of ModelPIFs-Clin were below the cutoff were classified in ModelPIFs-Clin-low subgroup, and those above it were classified in ModelPIFs-Clin-high subgroup. The immune contexture was distinct between the two subgroups. ns: not significant; *p < 0.05; **p < 0.01; ***p < 0.001; ****p < 0.0001.