
Figures & data
Figure 1. Study flow chart. MWA:microwave ablation; AZ: ablation zone.
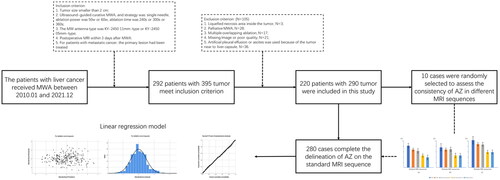
Figure 2. Postoperative MRI image processing. (a) Selecting MRI sequence; (b) Using the threshold function that comes with 3Dslicer to delineate AZ; (c) Correcting the outline of AZ manually; (d) Generating the 3D-shape of AZ automatically; (e) Rotating and projecting the 3D-shape to find the section with the largest area as the standard section of AZ; (f) Calculating the AZ length width and area. AZ: ablation zone.
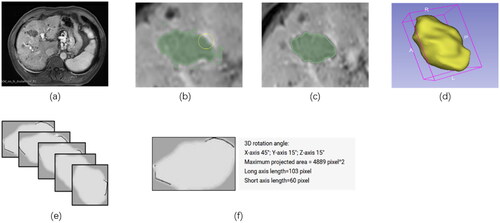
Table 1. Baseline of all cases.
Figure 3. CV of multiple MRI sequences for AZ length (a); width (b); area (c). CV: coefficient of variation; AZ: ablation zone.
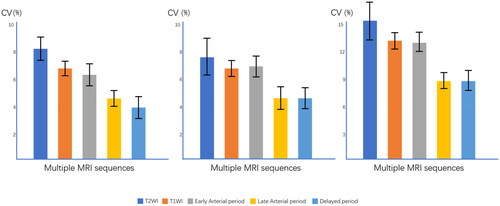
Table 2. Linear Regression for AZ in all cases.
Table 3. Linear Regression for AZ in hepatitis patients.