
Figures & data
Figure 1. Total parenteral nutrition (TPN) configuration tool.
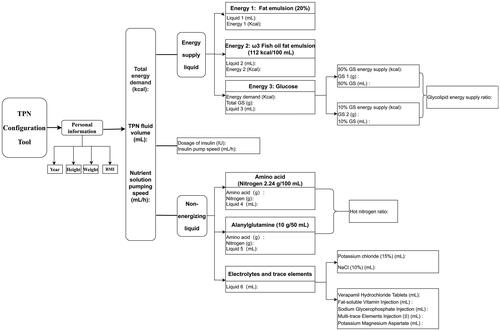
Figure 2. Statistical tool for assessing postoperative input and output.
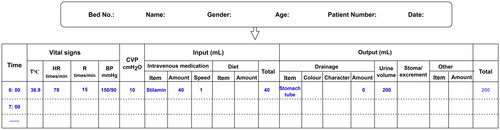
Table 1. Major clinicopathological characteristics, preoperative cardiac and renal function parameters of PMP patients in this study.
Table 2. Major CRS + HIPEC characteristics of PMP patients between control and study groups.
Figure 3. Comparison of fluid volumes in control vs. study groups by postoperative day (POD). (A) Comparison in median fluid volume on POD1 (**p = 0.002); (B) Comparison in median fluid volume on POD2 (***p < 0.001); (C) Comparison in median fluid volume on POD3 (***p < 0.001).
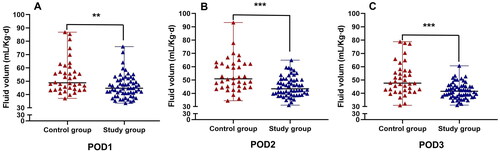
Table 3. The degree and duration of postoperative elevation in cardiac and renal function parameters between control and study groups.
Table 4. SAEs between control and study groups.
Table 5. Correlation analysis of postoperative NT-proBNP and myocardial injury markers with cardiovascular SAEs after CRS + HIPEC in PMP patients.
Figure 4. Survival analysis. (A) Overall survival analysis of all patients; (B) Survival curve analysis of control group and study group.
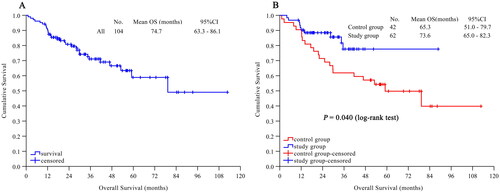
Figure 5. Univariate analysis of survival. (A) Pathological grading; (B) CC score; (C) CTNI > ULN.
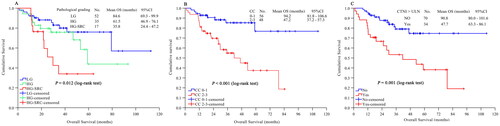
Table 6. Multivariate survival analysis of PMP patients after CRS + HIPEC.