Figures & data
Figure 1. Schematic of the home-made phantom. In this study, only the MRT of the vial in the center, containing the water mixture, is analyzed. The outer four fat vials are used for correcting for the B0 drift.
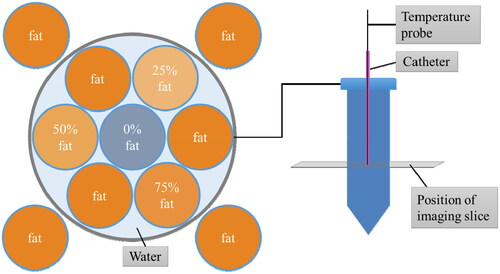
Figure 2. Flow chart of post-processing of experimental data. More detailed information on the methods in general can be found in the text, and specifically on MMT-PRFS in Appendix A.1.
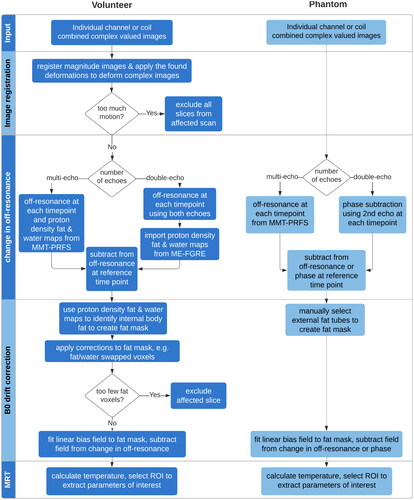
Figure 3. Example fat mask (of bone marrow) with volunteer 1, slice 1. The fat mask is overlaid on the magnitude image of echo 1 at time point 2.
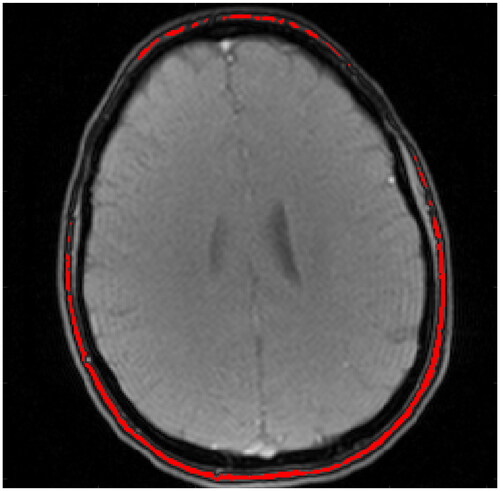
Table 1. MRT performance quantities used for comparison between sequences.
Figure 4. ROIs chosen for MRT evaluations. (A) shows the ROI for the phantom: only the vial in the center containing water mixture was selected; and (B) for the volunteers: encompassing an elliptical volume of brain tissue, as large as possible while constant among all volunteers.
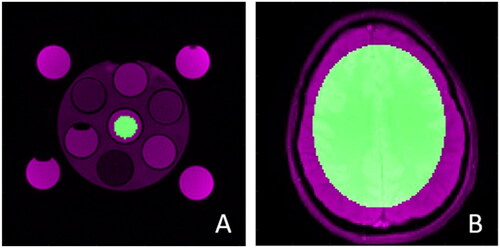
Table 2. Acquisition parameters and scan times for different sequences for the phantom experiment.
Table 3. Parameters of all the sequences as well as their respective scan times for the volunteer experiment using the multi-channel GE head coil (22 channels).
Table 4. MRT performances from the multi-coil phantom experiment for the whole temperature range (top) and the clinically HT range 37–43 °C (bottom).
Figure 5. Temperature change MRT maps of the phantom cooling down, shown at different time points.
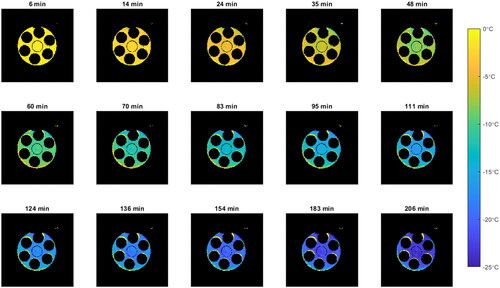
Figure 6. Temperature measured by MRT (mean of the ROI evaluated ± SD) vs. the temperature measured by the thermometer probe during the cooling down of the phantom experiment. Each dot represents a temperature reading at a distinct time point for which the acquisition time from the MRI scanner is taken. The dashed line illustrates the perfect scenario, where the temperature of the probe and the temperature measured with the MRI are matching. A shows the entire temperature range, referenced to the first time point acquired during the experiment; and B shows only the clinical temperature range of 37–43 °C, referenced to the time point closest to (and above) 37 °C. The bias, spatial SD, temporal SD and accuracy are presented in for both the extended range and the reduced treatment relevant range.
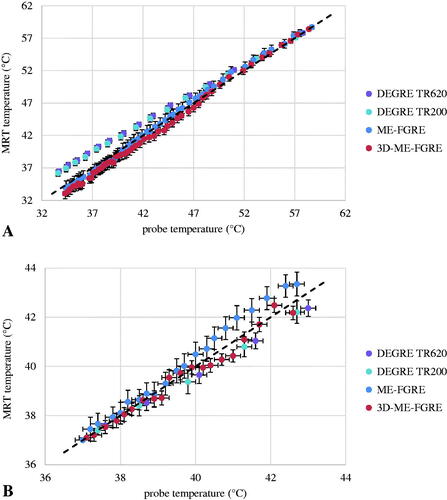
Figure 7. MR temperature estimations for all sequences (shown for one slice and one volunteer).
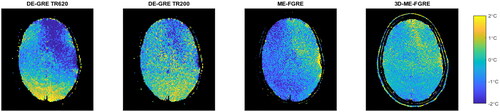
Figure 8. Accuracy achieved for all sequences in the volunteer experiments, including all scans and excluding scans with too much motion and too few fat voxels (9/10 volunteers remaining). Accuracy was calculated as mean absolute deviation over all slices of the mean deviation from zero of the apparent temperature change in the ROI for each slice.
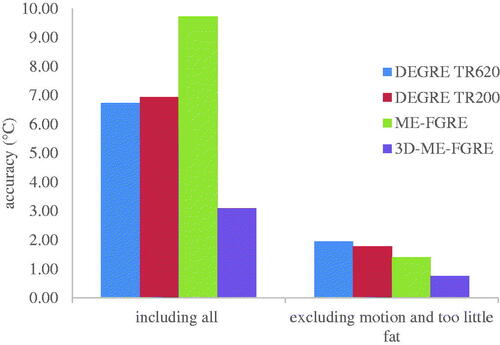
Table 5. MRT performances averages of 10 volunteers in brain over all slices, including all and excluding motion and too little fat voxels.
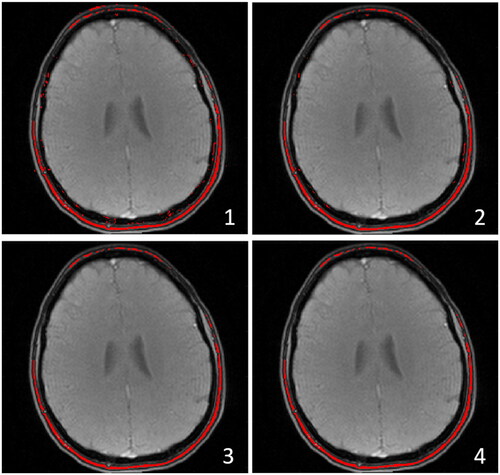
Figure A1. Example fat mask selection (of bone marrow) with volunteer 1, slice 1, (echo 1 of magnitude image), at time point 2. (1) Shows the initial mask, (2) eliminating fat-water swapped voxels, (3) including a signal threshold and (4) eliminating the residual outliers which is at the same time also the final fat mask. For this particular volunteer there were no residual outliers, so step 3 to 4 was superfluous.