
Figures & data
Figure 1. Schematic diagram of experimental design (A) and HIFU ablation (B).
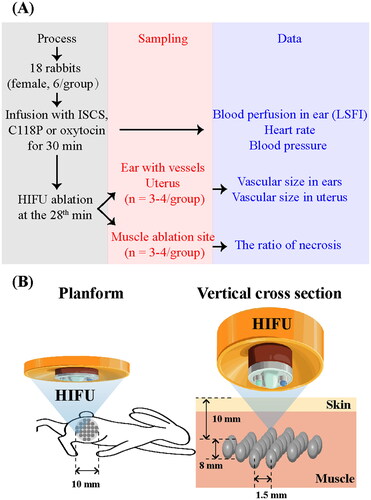
Figure 2. Changes of blood perfusion for rabbit auricular vessels in the ISCS, C118P and oxytocin groups. (A) LSFI for the three groups. Dotted and solid line frames indicate the central auricular artery and marginal auricular vein, respectively. The chromaticity bar indicates the PI value for pseudo colors, indicating the relative flow of blood perfusion. (B) Statistical analysis of the PI changes in the three groups. Mean value of PI was significantly different from that of the pre-perfusion level: *p< .05, **p< .01 in the C118P group, and #p< .05, ##p< .01 in the oxytocin group. N = 6 per group.
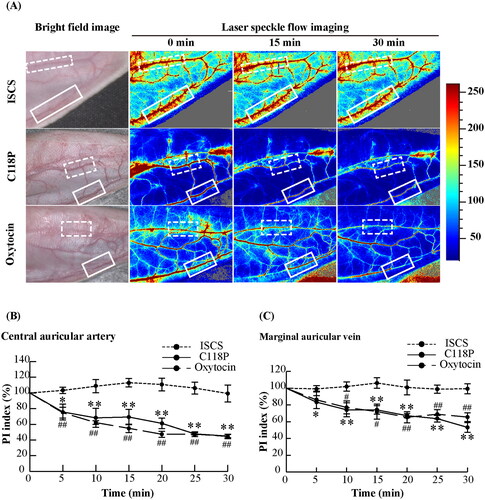
Figure 3. Vascular changes in rabbit ears and uterus in the ISCS, C118P and oxytocin groups. (A) Microscopic imaging of HE staining for central auricular arteries and marginal auricular veins. Bar: 250 μm. (B, C) Statistical analysis of the circumferences for central auricular arteries (B) and marginal auricular veins (C). Data were significantly different: *p< .05 (n = 3 per group). (D) Microscopic imaging of HE staining for uterine blood vessels. The green line shows the blood vessel outline. Bar: 50 μm. (E) Statistical analysis of the area ratio for uterine blood vessels. Data were significantly different: ***p< .001 (n = 4 per group). (F) Correlation analysis between central auricular arteries and uterine blood vessels. (G) Correlation analysis between marginal auricular veins and uterine blood vessels.
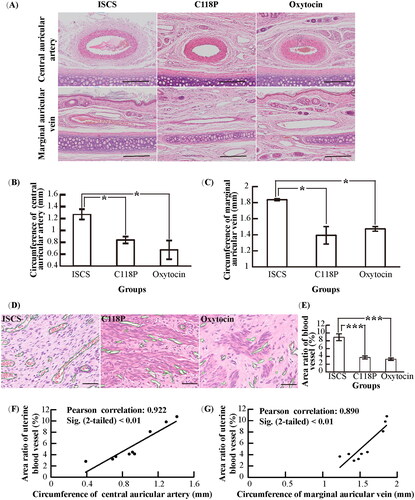
Figure 4. The ablative efficiency of HIFU in the ISCS, C118P and oxytocin groups. (A) Ultrasound imaging and macroscopic view of postmortem samples for muscle tissues under HIFU ablation. Bar: 10 mm. (B) Microscopic imaging of HE and NADH-TR staining for ablated muscles. The contour in images for NADH-TR staining indicates a necrotic area. Bar: 2.5 mm. (C) Statistical analysis of the necrosis ratio. Data were significantly different: *p< .05 (n = 3 per group).
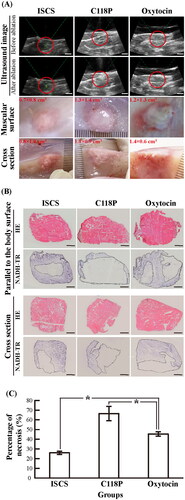
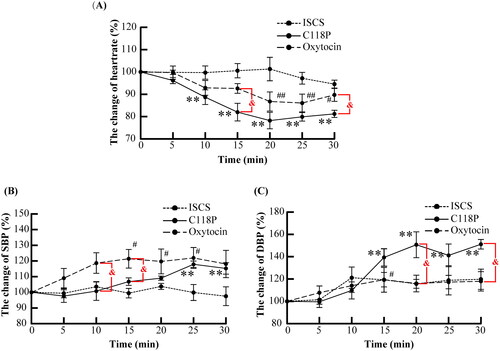
Figure 5. Statistical analysis of the changes in heart rate (A) and blood pressure (B, C) in the ISCS, C118P and oxytocin groups. Mean value was significantly different from that of the pre-perfusion level: **p< .01 in the C118P group, and #p< .05, ##p< .01 in the oxytocin group. Data were significantly different between the C118P and oxytocin groups: &p< .05.
Data availability statement
The data used and analyzed during the current study are available from the corresponding author upon reasonable request.