
Figures & data
Figure 1. Medical devices and probes utilized during the RAB MWA in swine lungs. (A) The MONARCH™ Platform, a robotic bronchoscopy system, consists of a navigation tower and a robotic cart (a). The MONARCH navigation tower includes a display for CT-guided bronchoscopic navigation and visualization of the lung airways, whereas the MONARCH cart houses the robotic arms that control the bronchoscope. The NEUWAVE™ FLEX Microwave Ablation System (b) consists of a touch screen display as the user interface, a microwave power amplifier, and a CO2-based cooling system. (B) NEUWAVE FLEX ablation probe inserted through the MONARCH working channel. (C) Fluoroscopic image of a MWA procedure performed in one of the animals included in the study (ID: 1) showing the contour of the probe inserted into the working channel. (D) Screenshot of the NEUWAVE touchscreen user interface depicting ablation settings.
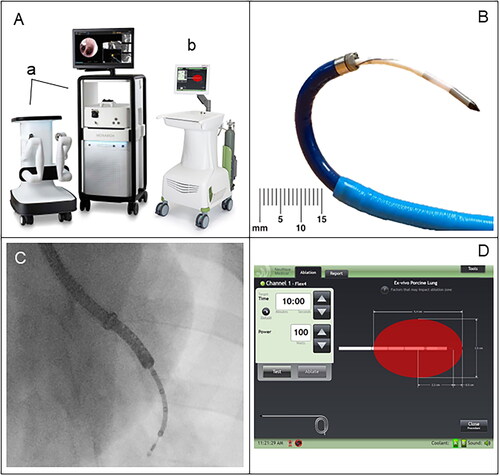
Table 1. AEs, radiologic (CT), pathologic, and molecular (PCR) assessments of lung tissue.
Figure 2. Representative post-ablation contrast-enhanced CT imaging findings in a Non-Survival (acute) animal. Ablations were performed at 100 W in the left cranial (A, 1 min), right middle (B, 3 min), left caudal (C, 5 min), and right caudal (D, 10 min), regions of the lung. Coronal plane images are shown. Ablation zones exhibit GGO areas of heterogeneously increased attenuation (white arrows).
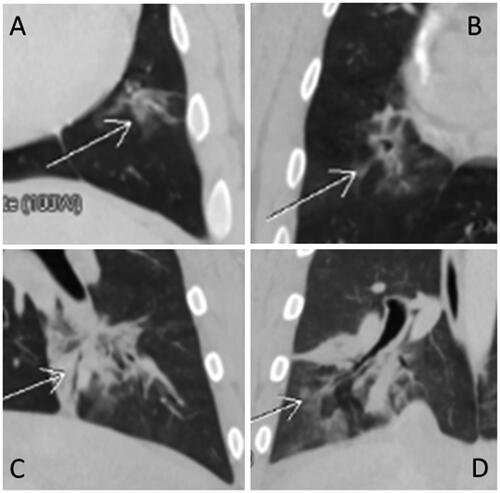
Figure 3. Representative post-ablation, contrast-enhanced CT images for 3-Day (A,B) and 30-Day (C,D) animals. MWAs (100 W, 10 min) were performed in the left caudal regions of the lungs in both animals. Regions where ablations were performed show typical GGO at day 0 in lungs of 3-Day (A) and 30-Day (C) animals. At Day 3, significant tissue density and some atelectasis were observed in the ablation region on Day 3 (B), whereas contraction/involution is shown in the ablation region on Day 30 (D).
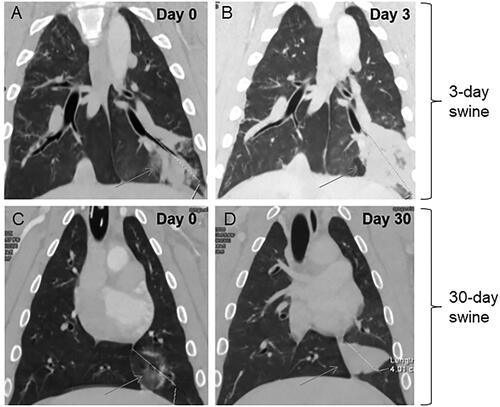
Figure 4. Necropsy photographs (A,B) and H&E histological images (C–H) of swine lungs displaying MWA treatment sites for the three experimental groups. (A) Left caudal lung lobe of a 3-day animal (ID: 9) before formalin fixation showing the treatment site on the pleural surface as a well-demarcated zone of dark red discoloration. (B) Tissue slices after formalin fixation of the right caudal lung lobe of an animal in the Non-Survival (acute) group (ID: 3) subjected to a 5-min ablation (100 W). Within the formalin-fixed lung parenchyma, the lesion is characterized by a central lighter-colored region surrounded by a zone of dark discoloration. The red and white lines indicate the MWA zone’s Length and minimum diameter (Dmin), respectively. A line orthogonal to Length and Dmin represents the maximum diameter (Dmax). (C,D) Low power images (C: 2×; D: 4×) of histological sections of a MWA site (100 W, 3-min) in the right middle lung lobe of a Non-Survival animal (ID:1). The ablation lesion is characterized by an outer zone of hyperemia (yellow star) with an internal region of degeneration/necrosis of the alveolar parenchyma (black stars). There is also degeneration of peribronchial connective tissue (brown stars). Interlobular septa are expanded due to edema (blue stars). (E,F) Low magnification (E: 2×; F: 10×) images of two regions of a MWA site in the left caudal lung lobe of a 3-Day swine (ID: 6) showing areas of coagulative necrosis (black stars), and normal tissue (green stars). The center of the image in panel E shows a region of variable hyperemia, moderate hemorrhage (yellow stars), and disorganized and degenerated alveolar tissue. Interlobular septa in both images are expanded due to edema (blue stars). (G,H) Low (G: 1.25×) and high (H: 20×) power images of a MWA treatment site in the right caudal lung lobe of a 30-Day swine (ID: 14). The low-power image in G displays a central zone of coagulative necrosis (black stars), and a large, circumferential, coalescing granulomatous lesion (red stars). A rim of fibrous tissue (arrows) demarcates the granulomatous lesion from the adjacent, normal lung parenchyma (green stars). The higher power photomicrograph in panel H displays a section of the central zone of coagulative necrosis in the ablation site (black stars), the granulomatous lymphocytic infiltrate adjacent to the necrotic core (red star), and a region of coccoid bacterial colonies (white star), which were detected in the MWA sites of four 30-Day animals.
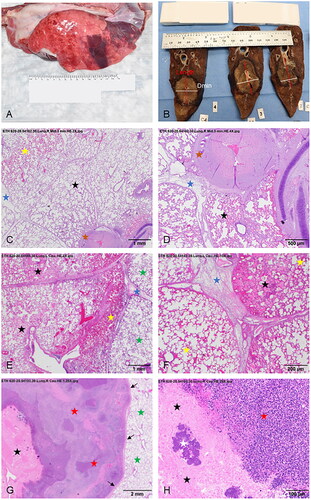
Figure 5. Histopathological scoring of alveolar edema (A), inflammation (B), hemorrhage (C), and vascular thrombosis (D) at the MWA sites. Only ablation sites treated for 10 min are depicted for the Non-Survival group. Thus, all ablation treatment sites shown received 100 W power for 10 min. Alveolar edema was common in the 3 groups; inflammation was observed in 3- and 30-Day ablation sites, whereas hemorrhage and thrombosis were present mainly in 3-Day ablation sites.
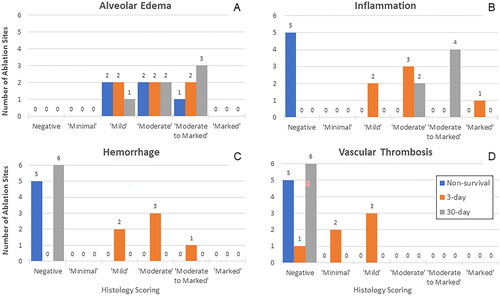
Table 2. Animal-level CT imaging volume measurements of the MWA sites.
Table 3. Animal-level gross pathology measurements of the MWA sites.
Table 4. Descriptive statistics for CT imaging and gross pathology measurements of the MWA sites.
Figure 6. (A) MWA volume (cm3) determinations based on CT as a function of ablation time in acute, Non-Survival animals. Four ablations at 1-, 3-, 5-, and 10-min duration were performed on each of the 5 animals. Volumetric measurements showed an increase in ablation volume as ablation time increased, indicating a time-dependency of the MWA procedure over the ablation time range examined (100 W, 1–10 min). Average CT ablation zone volumes at 3, 5 and 10 min showed 1.8-, 2.7- and 4.8-fold increases, respectively, compared to the average ablation zone volume at an ablation duration of 1 min (n = 5). (B) MWA volume (cm3) based on CT scans at days 0, 3 and 30 for animals in the subacute (3-Day, n = 6) and chronic (30-Day, n = 6) groups. Ablation measurement increased at 3 days and involuted/contracted at 30 days post-ablation. (C) MWA volume (cm3) determinations by gross pathology as a function of ablation time in acute, Non-Survival animals. (D) MWA volume (cm3) measurements by gross pathology at days 0, 3 and 30 for the subacute (3-Day) and chronic (30-Day) groups of animals. Ablation measurement increased at 3 days and contracted at 30 days post-ablation. Box plots display the five-number summary for each set of data (minimum, Q1, median, Q3, and maximum). Crosses within box plots represent mean values.
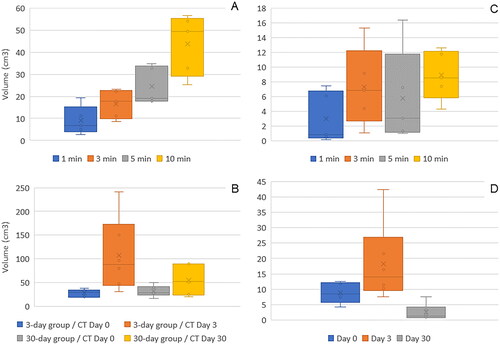
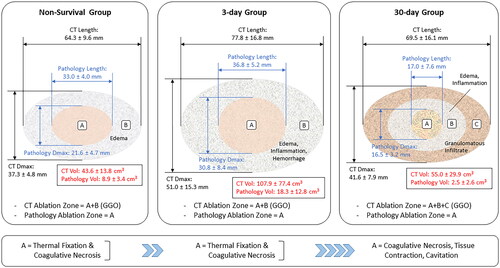
Figure 7. Schematic representation of the MWA site as determined from GGO areas in CT sections and TTC-stained areas in gross pathology slices. Ablation settings were identical for the 3 experimental groups shown (100 W, 10 min). Measurements for the Non-Survival group correspond to Day 0, whereas those for the day-3 and day-30 groups were obtained on Day 3 and Day 30, respectively. Ablation volume was determined with the same ellipsoidal formula for the CT- and Pathology-based sets of measurements. MWA zones were radiologically defined in CT scans as homogeneous GGO areas, whereas gross and histopathological analysis of the MWA site distinguished several concentric areas. A central thermal fixation zone surrounded by an area of coagulative necrosis was observed in formalin-fixed tissue slices in the MWA sites of all groups. These regions, represented by A in the left and central panels, were surrounded by edema in the ablation sites of Non-Survival animals (B on the left panel), and by a larger area of edema, inflammation, and hemorrhage in the ablation sites of 3-Day animals (B on the middle panel). Edema and inflammation were less marked in the MWA sites of 30-Day animals; however, a granulomatous infiltrate adjacent to the area of edema and inflammation (C on the right panel) surrounding the MWA site was observed in all chronic swine. In the swine model used in the present study, areas labeled B in the Non-Survival and 3-Day groups, and B and C in the 30-Day group may have contributed to an overestimation of the GGO areas and thus the ablation zone in CT images of the MWA sites. The model’s schematics shown are scale drawings that kept the aspect ratio of the original CT- and pathology-based measurements (Length and Dmax). Data are expressed as mean ± SD. CT: computed tomography, Dmax, maximum diameter, GGO: ground-glass opacity, Vol: volume.
Supplemental Material
Download PDF (214.3 KB)Data availability statement
The authors confirm that the data supporting the findings of this study are available within the article and its supplementary materials.