
Figures & data
Table 1. The primer sequences for RT-qPCR analysis.
Figure 1. Characteristics of isolated exosomes. Serum exosomes were isolated from LC patients with recurrence before and after microwave ablation (MWA). (A) Electron micrograph observation. (B) Size distribution of the exosomes. (C) Western blot for exosome markers of CD81, CD63 and HSP70. The isolated vesicles were consistent with the characteristics of exosomes, indicating that exosomes were successfully isolated.
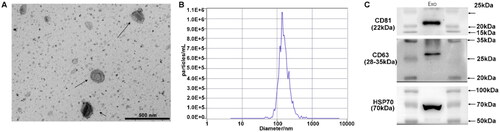
Figure 2. Identification of differentially expressed (DE) miRNAs and verification. (A) Volcano plot of DE miRNAs in exosomes after ablation compared with that before ablation by small RNA sequencing. (B) Heat map of DE miRNAs. (C) RT-qPCR analysis of five miRNAs in clinical exosome samples before and after ablation. *p<.05. (D) CCK8 assay for A549 cell viability after transfection with pCDH-miR-133a-3p, miR-455-3p, miR-584-5p, miR-629-3p,miR-3605-3p or miRNA NC vectors. Then, miR-133a-3p was screened for further analyses.
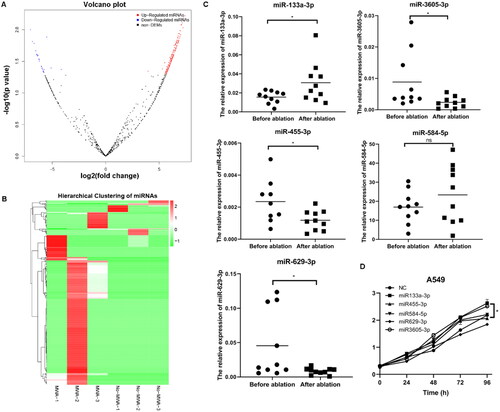
Figure 3. The condition of microwave ablation (MWA) in A549 cell determination in vitro. To simulate MWA in vitro, A549 cells were treated with temperature gradients (45 °C, 47 °C and 50 °C) for 10 min. (A) Light microscopy assay for cell observation (bar = 100 µm, magnification × 100). The cells were almost dead in the 50 °C treatment group. So, survival cells after treatment of 45 °C and 47 °C for 10 min were collected for CCK8 and migration test. (B) CCK8 assay for cell viability after treatment at 45 °C and 47 °C for 10 min. (C) Transwell assay for detection of cell migration ability at 45 °C and 47 °C. Untreated cells were used as controls. Bar = 50 µm, magnification, 200×. *p<.05. The cell viability in the 45 °C treatment group was comparable to that of the controls. Therefore, cell ablation in vitro was performed at 45 °C for 10 min in the following studies.
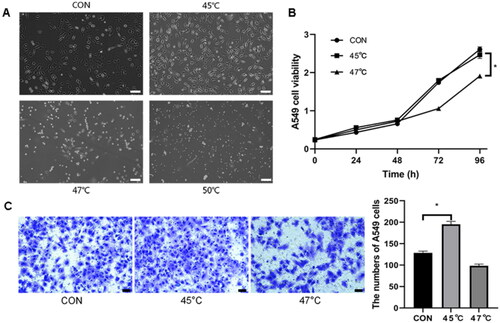
Figure 4. Effect of miR-133a-3p overexpression on proliferation, invasion and migration of A549 cells. A549 cells were transfected with pCDH-miR-133a-3p and the negative control, then, exosomes were isolated from the A549 cell culture supernatant. (A) RT-qPCR analysis of the miR-133a-3p expression in exosomes derived from A549 cell supernatants. miR-133a-3p was highly expressed in the miR-133a-3p-OE-Exo group, indicating high transfection efficiency. (B) PKH26-labeled exosomes were co-incubated with A549 cells for exosome uptake analysis. Cell supernatant-derived exosomes were internalized by recipient A549 in a time-dependent manner (blue in the merge). (C) CCK8 assay for A549 cells coincubated with exosomes from cells overexpressing miR-133a-3p and those subjected to MWA treatment. The cell viability in the miR-133a-3p-OE-exo group was significantly higher than that in the miRNA-NC-exo group (p <.05). (D) Transwell assay for migration and invasion ability. 200×, bar = 50 µm. (E) Cell scratch assay for A549 cell wound repair ability. 40×, bar = 100 µm. Migratory and invasive abilities of A549 cells were significantly enhanced after co-incubation with miR-133a-3p-OE-exo and MWA-exo, as reflected by the increased number of migrating and invading cells in the transwell assay and enhanced wound healing ability. (F) tube formation assay for angiopoiesis. 40×, bar = 100 µm. (G) EdU assay of cell proliferation. Bar = 20 µm. *p < .05. miR-133a-3p-OE-exo treatment markedly promoted the tube-forming ability and proliferation of A549 cells. Above results suggest that the overexpression of exosomal miR-133a-3p is positively associated with the growth and metastasis of LC cells.
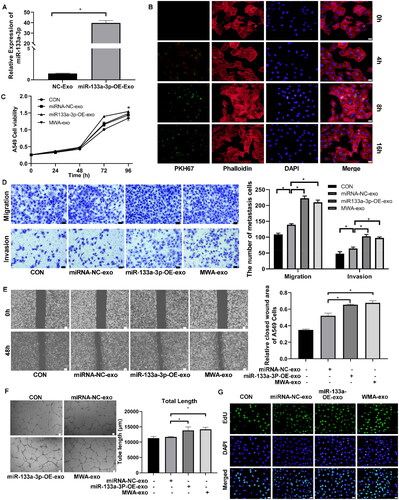
Figure 5. Gene target of miR-133a-3p. The target genes of miR-133a-3p were predicted using 12 databases (e.g., miRWalk, Microt4 and miRanda). Tumor suppressor genes (TSGs) with downregulated expression in solid tumor tissues were predicted using TSGene v2.0. (A) TSGs as potential targets of miR-133a-3p were predicted by Venn analysis. (B) Western blot for SIRT1 expression in A549 cells overexpressing miR-133a-3p. (C), Western blot for Septin 4 expression in A549 cells overexpressing miR-133a-3p. (D) Dual-luciferase reporter assay for the interaction between miR-133a-3p and SIRT1. *p < .05.
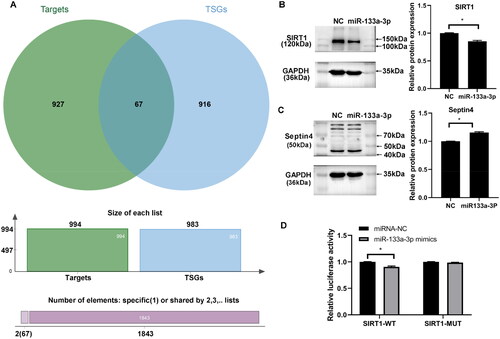
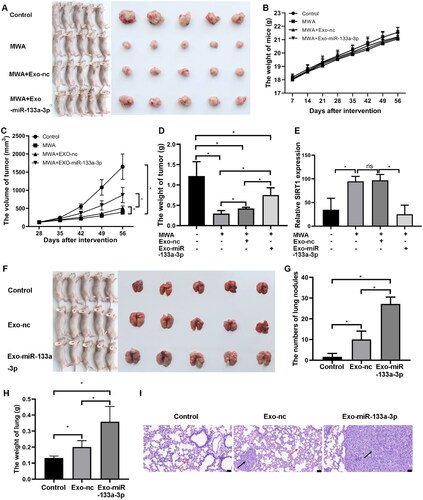
Figure 6. Effect of miR-133a-3p on LC development in vivo. Nude mice were subjected to subcutaneous tumorigenesis model construction followed by MWA. Exosomes derived from miR-133a-3p/miRNA-NC-transfected A549 cells were then transplanted into the caudal vein of mice. (A) Mice in the MWA + Exo-miR-133a-3p group formed larger tumors compared to the MWA + Exo-nc and MWA groups. (B) No significant differences were observed in mouse body weight among the groups. (C) Comparison of tumor volumes. (D) Comparison of tumor weights. (E) Quantitative analysis of immunohistochemical staining for SIRT1 expression in tumors. (F) Nude mice bearing lung tumors were injected with exosomes isolated from A549 cells transfected with pCDH-miR-133-3p and pCDH-miRNA-nc. Lung size in the Exo-miR-133a-3p group was larger than that in the Exo-nc and control groups. (G) Comparison of lung nodules among the different groups. (H) Comparison of lung weights in the different groups. (I) HE staining for changes in histological lesions. Red arrows represent granulocyte infiltration, and black arrows indicate tumor cells with deformed nuclei and blurry nucleoli. Bar = 50 µm, * p <.05.
Supplemental Material
Download PDF (37.6 KB)Data availability statement
All data generated or analyzed during this study are included in this published article.