
Figures & data
Figure 1. Flowchart of the patient selection criteria.
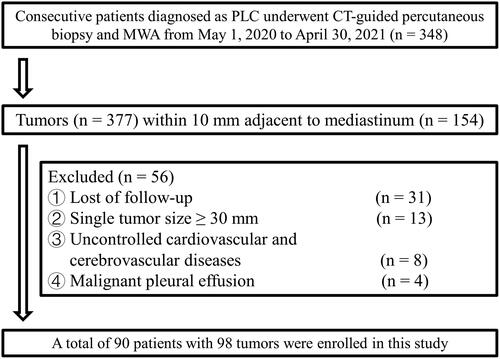
Table 1. Baseline characteristics, efficacy and LPFS.
Figure 2. Diagram of the relationship between tumors (white arrows) and mediastinum. (A) Stellate tumor (white arrow) directly invading the great vessels (0 mm). (B) A round tumor adjacent to the great vessels (1–5 mm). (C) A round tumor near the great vessels (5–10 mm). (D) A round tumor directly invading the pericardium (0 mm). (E) Round tumor adjacent to the pericardium (1–5 mm). (F) Ground-glass nodule near the pericardium (5–10 mm).
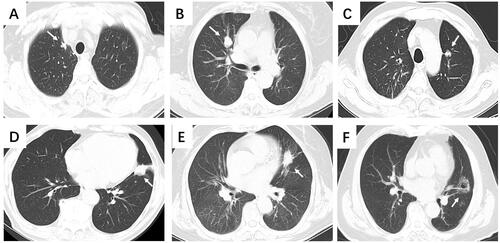
Figure 3. A typical case of secondary ablation treatment. The following images were of a 75-year-old patient with a 28-mm lesion of primary lung squamous cell carcinoma. The patient developed local progression 6 months after the first-line ablation without any other drug therapy and achieved a long-term PFS (24 months after the deadline for submission) after secondary ablation combined with chemotherapy and immunotherapy. (A) Chest computed tomography (CT) scan obtained before microwave ablation (MWA) shows a 28-mm well-defined round tumor (white arrow) in the left lobe (lesion adjacent to the aorta). (B) In the supine position, MWA was performed for the lung tumor. (C) CT after 24 h of the procedure; exudation and pleural effusion reduced. (D) CT performed 1 month after the procedure; the ablation area completely covered the tumor. (E) CT after 6 months of the procedure; ablation area increased. (F) CT 6 months after the procedure; Enhancement was seen in part of the tumor (triangular arrows). (G) In the supine position, MWA was performed for the enhanced part. (H) CT performed 1 month after the procedure; The ablation area completely covered the tumor. (I) CT after 3 months of the procedure; ablation area reduced. (J) CT after 6 months of procedure; cavity occurred in ablation areas. (K) CT after 24 months of the procedure; cavity shrunk. (L) CT after 24 months of the procedure; ablation area reduced.
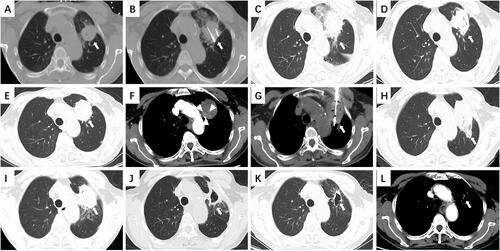
Table 2. Complications.
Figure 4. Structural changes: adhesions to extracardiac structures. (A) The tumor (white arrow) is adjacent to the pericardium (minimum distance was 4 mm). (B) In the supine position, the antenna punctured the proximal end of the tumor, parallel to the pericardium. (C) CT 24 h after the procedure; the exudation and ablation area completely covered the tumor. (D) CT 1 month after the procedure; Adhesions to the extracardiac tissue (triangular arrow). (E) CT after 6 months of the procedure; adhesions to the extracardiac tissue. (F) CT 14 months after the procedure; Abnormally thick adhesions reduced (triangular arrow).
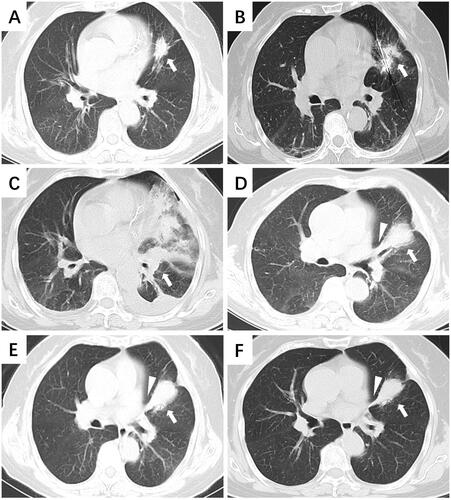
Figure 5. Structural changes: thickening of the mediastinal layers. (A) An 18-mm mixed ground-glass nodule (white arrow) was closer to the mediastinum without an end-inspiratory hold (lesion near the mediastinum within 10 mm). (B) In the supine position, the antenna punctured the center of the tumor parallel to the mediastinum. The minimum distance between the ablation antenna and mediastinum was less than 10 mm [triangular arrow]. (C) CT performed 24 h after the procedure revealed pleural effusion and further thickening of the mediastinal layers (triangular arrow). (D) CT 1 month after the procedure: The ablation area completely covered the tumor, and there was indistinct separation from the mediastinum layers. (E) CT 6 months after the procedure: Local thickening of the mediastinal layers. (F) CT performed 16 months after the procedure: The mediastinal layers returned to almost normal.
![Figure 5. Structural changes: thickening of the mediastinal layers. (A) An 18-mm mixed ground-glass nodule (white arrow) was closer to the mediastinum without an end-inspiratory hold (lesion near the mediastinum within 10 mm). (B) In the supine position, the antenna punctured the center of the tumor parallel to the mediastinum. The minimum distance between the ablation antenna and mediastinum was less than 10 mm [triangular arrow]. (C) CT performed 24 h after the procedure revealed pleural effusion and further thickening of the mediastinal layers (triangular arrow). (D) CT 1 month after the procedure: The ablation area completely covered the tumor, and there was indistinct separation from the mediastinum layers. (E) CT 6 months after the procedure: Local thickening of the mediastinal layers. (F) CT performed 16 months after the procedure: The mediastinal layers returned to almost normal.](/cms/asset/937c9bbf-8b79-4b93-abff-70a6f8ccae0e/ihyt_a_2193362_f0005_b.jpg)