
Figures & data
Figure 1. Acquisition timing and experimental protocol. (A) Multi-slice temperature images were dynamically acquired every 1.2 s for 6 min. Three different multiband accelerations were tested, with a minimum acquisition time of 398 ms. To simulate a respiratory motion, a periodic displacement of the phantom (f = 0.2 Hz) was generated with an amplitude of 10 mm. (B) The slice position was rotated from 0° (in-plane motion), 8°, 14° to investigate the influence of an out-of-plane motion on the thermometry results. Each acquisition set was repeated twice (except for 14° rotation) with a minimum delay of 4 min between consecutive acquisitions, to investigate the repeatability of the measurement.
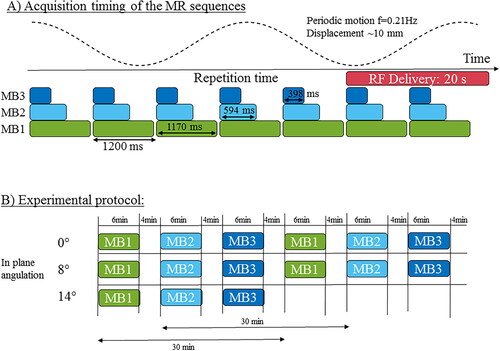
Figure 2. In-line reconstruction and temperature calculation. (A) In-line reconstruction was performed using the Gadgetron framework. A schematic block diagram of the implementation is presented (a Gadget being a reconstruction module in which data passes through). EPI ghost-Nyquist correction and coil compression were implemented to compute phase navigator and coil reduction by a stack of slices instead of independently for each slice. Average and specific phase navigators were up-streamed to the reconstruction Gadget. Slice-aliased images were separated using a slice-GRAPPA algorithm already available. Both CPU and GPU versions of the pipeline were implemented. (B) Temperature calculation was reprocessed offline: two different workflows were investigated: while the 2D workflow corrects the intra-slice motion only for the first reference image, the 3D workflow corrects the intra-slice motion for each incoming volume. Then correction of residual in-plane respiratory motion and associated susceptibility variations and compensation of spatial-temporal drift were used to compute temperature maps.
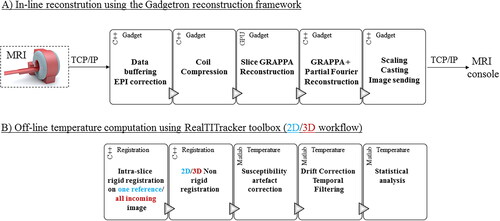
Figure 3. Influence of the multiband acceleration in presence of translation motion. Experimental data obtained on a moving agar gel phantom with three different MR-acquisitions. A periodic motion along y (vertical direction on images) was applied on the gel. One repetition in the (x,y) plane and twelve successive repetitions in the (x,z) plane are displayed for multiband (MB) acceleration factors of 1, 2, and 3 (TR= 955/671/445 ms) without (A, left panel) and with (B, right panel) 2D motion correction workflow.
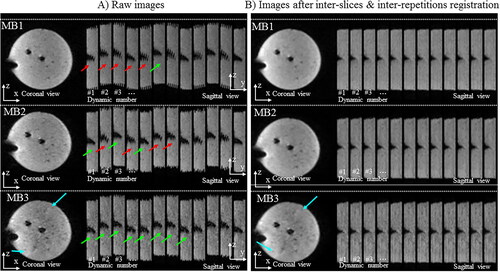
Figure 4. Influence of multiband acceleration factor during temperature monitoring. Experimental data obtained on a moving agar gel phantom using three different MR acquisitions with an MB factor of 1, 2, 3 respectively. 3 orthogonal views are reported, the motion is aligned with the z-axis. For each acquisition, two temperature maps during heating and two maps temperature maps before/after heating are shown. RF delivery was sent at dynamic acquisition #70 for 30 s. The (x,y) and (y,z) planes indicate that spatial homogeneity of the heating is preserved into each pseudo-volume. Similar behavior during temperature rise and cooling is noticeable. Slices far from the electrode do not show interslice leakage artifacts. A minimum threshold of 2 °C was used for displaying temperature maps.
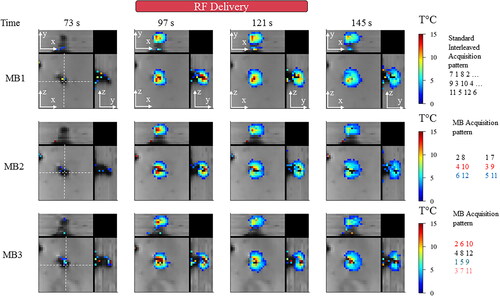
Figure 5. Influence of multiband acceleration factor. Experimental data obtained on a moving agar gel phantom using three different MR acquisitions with an MB factor of 1, 2, 3 respectively. (A). Average registered magnitude image close to the electrode (B), temporal standard deviation temperature maps (or temperature uncertainty) before heating (C) temperature maps during heating (D), RMSE maps over 60 consecutive temperature images acquired during RF delivery. Results for each acquisition are plotted: 1 (left), 2 (middle) and 3 (right). (E) Temperature evolution in a 4 × 4 kernel (see dashed square line) of voxels located close to the electrode with a multiband acceleration of 1 (in red), 2 (in blue) and 3 (in green). The slice number is 8.
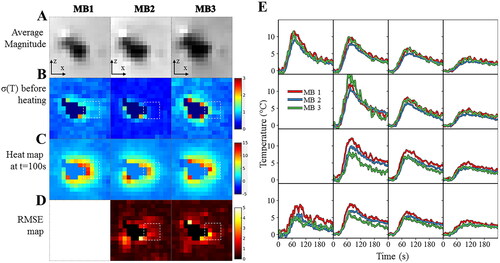
Figure 6. Evaluation of the repeatability of two measurements in the selected ROI around the electrode with the same or different MB. Experimental data obtained on a moving agar gel phantom using a sequence of six MR acquisitions (2 times for each multiband acceleration of 1, 2, 3) performed in controlled condition. The experimental protocol is presented in . The resulting temperature rises around the electrode (60 consecutive temperature images acquired during RF delivery) is compared using Bland Altman plots either with the same multiband acceleration (diagonal boxes) or with a different multiband acceleration (off-diagonal boxes). For each plot, the bias (blue dotted lines) and limits of agreement (orange dotted lines) are indicated. The fit of the dots (red lines) indicates either no bias, a fixed bias or a proportional bias.
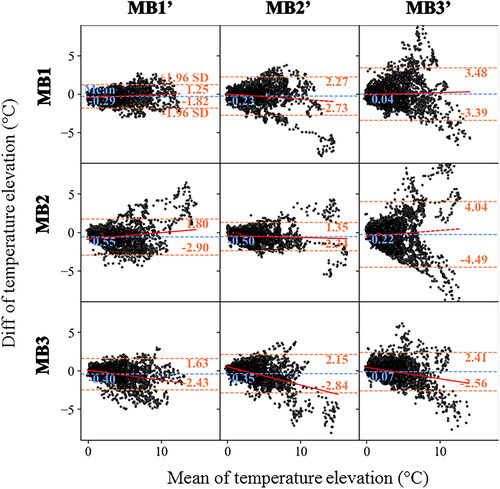
Figure 7. Influence of motion correction in presence of out of plane motion. Experimental data with a multiband acceleration of 2 obtained on a moving agar gel phantom with the angulation of 0° (A), 8°(B), 14°(C) between the imaging plane and the main direction of the motion. For each, two different registration workflows 2D (top) versus 3D (bottom) are compared by showing the difference between the current image and the reference image before (I–Iref) and after registration (Ireg–Iref). The difference is overlaid on the magnitude image using a color code (green-pink). The white and red arrows indicate the absence or the existence of residual misalignments, respectively, close to the electrode or at the border of the gel. RMSE computed over 60 repetitions between the registered images and a reference image are shown (panel D) in a box and whisker plot for 3 different acquisitions on a moving agar gel phantom with an angulation of 0°, 8°, 14°. For each, the 2 different registration workflow 2D (red) versus 3D (blue) are compared.
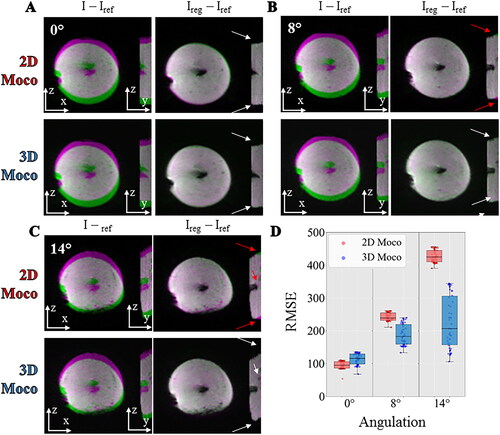
Figure 8. Influence of the registration workflow in presence of out-of-plane motion (8°). Experimental data obtained on a moving agar gel phantom using a multiband acceleration of 2. (Right) Registered averaged images (A,B) and temperature uncertainty (C,D) with 2D (A,C) or 3D (B,D) registration for the tilted acquisitions. (Left) Temperature evolution in time close to the electrode with 2D (in red) and 3D (in blue) registration workflow. The acquisition was performed with MB = 2. Green and orange arrows indicate typical patterns of temperature artifacts due to residual out-of-plane motion either with small oscillations or larger oscillations close to the RF electrode.
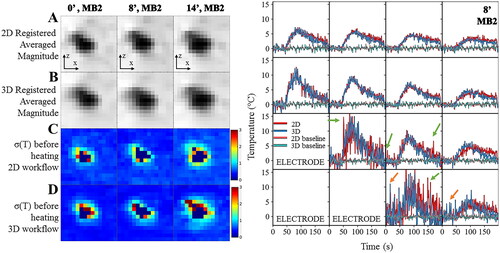
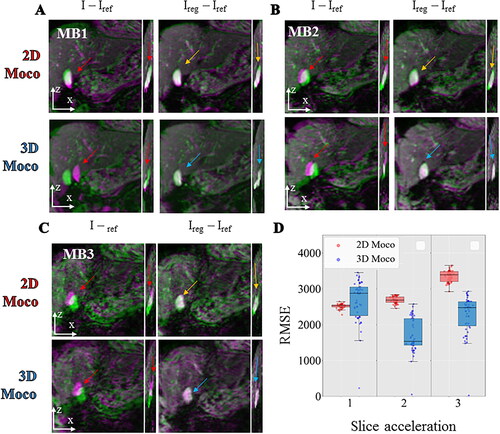
Figure 9. Comparison between 2D vs 3D motion correction in in vivo acquisition of the liver with different multiband acceleration factors. For each, 2 different registration workflows (top: 2D, bottom: 3D) are compared by showing the difference between the current image and the reference image before (I–Iref) and after registration (Ireg–Iref). The differences are overlaid on the magnitude image using a color code (green-pink) for each multiband acceleration 1 (panel A), 2 (panel B), 3 (panel C). RMSE computed over 50 repetitions between the registered images and a reference image are shown (panel D) in a box and whisker plot for 3 different acquisitions on a moving agar gel phantom with a multiband acceleration of 1, 2, 3. For each, the 2 different registration workflow 2D (red) vs. 3D (blue) are compared.
Supplemental Material
Download PDF (729.1 KB)Data availability statement
The data that support the findings of this study are available at this link (https://doi.org/10.5281/zenodo.7643565). To ease use of the SMS-EPI in such a context, support our findings and promote the reproducibility of the results, an open-source reconstruction code (https://github.com/LIRYC-IHU/gadgetron-sms) was developed to ensure an optimal phase reconstruction for temperature reconstruction. Compatibility with the two widely available SMS sequences on Siemens scanners (the commercial product and the CMRR C2P) were set up. In-line reconstruction presented in the study is therefore accessible to all major fMRI sites where CMRR sequences are usually available. After a minor modification on the scanner, the proposed reconstruction can be used with a limited latency (the code being not yet optimized for real-time reconstruction). Compatibility with in-plane parallel imaging and partial Fourier has only been tested for multiband acceleration of 2 and 3 which currently limits the use of the reconstruction for other applications.