
Figures & data
Figure 1. Flow chart of research process.
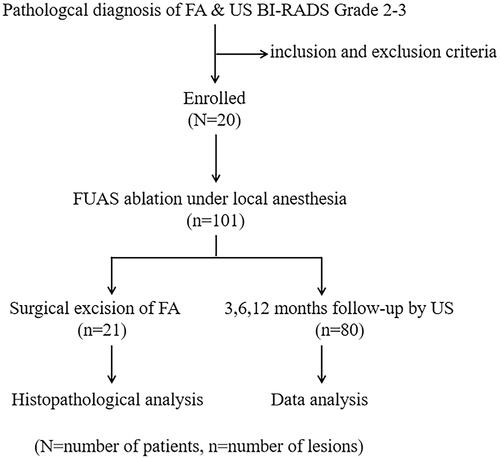
Figure 2. Changes of FA lesions treated with FUAS under real-time ultrasound monitoring. (A) Before treatment. (B) Hyperechoic scale changes occurred in the lesion during treatment. (C) Hyperechoic scale changed area covered the whole FA.
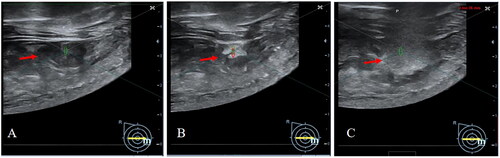
Table 1. Baseline characteristics of patients (N = 20).
Table 2. Characteristics of FA lesions (n = 101).
Table 3. FUAS treatment results for FA lesions (n = 101).
Figure 3. Skin safety after FUAS. (A) A 23-year-old woman with 8 FAs in the left breast. Left: pre-FUAS, skin marks of FA lesions were made under ultrasound imaging. Right: post-FUAS, the breast skin became a little pale after immersed in cold water, with no skin burn found after treatment. (B) A 35-year-old woman with a history of OS had 4 FAs in the right breast. Left: pre-FUAS, skin marks of FA lesions were made under ultrasound imaging. Right: post-FUAS, the breast skin became a little pale after immersed in cold water, with no skin burn found around the old scar (red arrow).
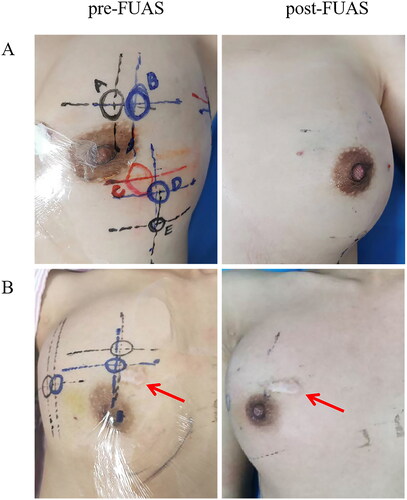
Figure 4. Pathological results of FA under light microscope or electron microscope. (A) TTC staining of FA. Left: Nonablated FA, red color indicating the viability of tumor cells. Right: Ablated FA. pale color indicating the occurrence of coagulation necrosis. (B) H&E staining. Upper row: Nonablated FA. Tumor tissue was composed of collagen and fibroblasts in rich stroma and distorted lobules, squeezed catheter. A thin line branching structure and fractured appearance lacuna was formed. Fibroadenomatoid changes were considered without signs of necrosis. Lower row: Ablated FA. Signs of coagulate necrosis were found, including nuclear pyknosis, karyorrhexis and karyolysis of tumor cells, unclear cell contour, and swollen collagen fibers with eosinophilic changes. (Magnification: Left, 40×; Middle, 100×; Right, 400×) (C) NADH staining. Upper row: Nonablated FA. Blue-stained spots suggested the viability of tumor cells. Lower row: Ablated FA. No blue- stained spot suggested the absence of vital cells. (Magnification: Left, 40×; Middle, 100×; Right, 400×) (D) TEM images. Upper row: Nonablated FA. The integrity of cell membrane and nuclear membrane, and morphology and distribution of organelles were observed. Lower row: Ablated FA. Destroyed cell membrane and nuclear membrane, damaged organelles were observed. (Magnification: Left, 5000×; Middle, 10000×; Right, 40000×) (E) SEM images. Upper row: Nonablated FA. Proliferative fibrous tissue could be seen on the surface of nonablated FA. Lower row: Ablated FA. Surface features of FA completely disappeared and the fibrous tissue structure of the tumor was destroyed. (Magnification: Left, 5000×; Middle, 10000×; Right, 40000×)
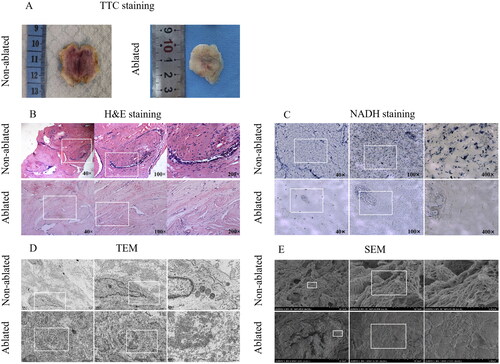
Figure 5. Percentage of volume remaining during follow-up. Percentage of volume remaining of FA at 3-, 6-, and 12-month post-ablation, which indicated that the tumor volume gradually and significantly shrank over time. At 12-month follow-up, the median percentage of FA volume remaining was 33.6% (*p < 0.05; **p < 0.01)
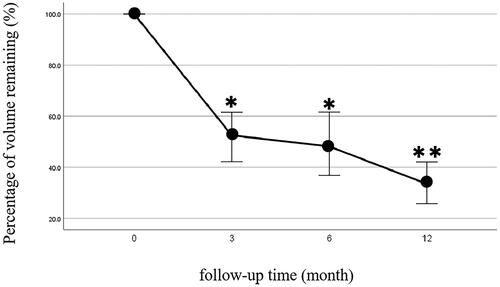
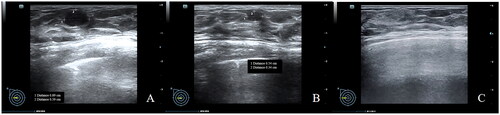
Figure 6. A typical ultrasound imaging in follow-up. (A) Pre-ablation. (B) At 3-month follow-up, FA volume decreased by 87.5%. C. At 6-month- follow-up, necrotic FA tissue was 100% absorbed.
Data availability statement
The authors confirm that the data supporting the findings of this study are available within the article.