
Figures & data
Figure 1. Thermal ablation applicator. (A): Thermal ablation device. (B) Technical drawing of the catheter for endoluminal thermal ablation model ClosureFast® (Medtronic, Mansfield, MA, USA) showing the inner elements and layers. The blue dashed line represents the catheter axis. (C) Detail of the catheter surface showing the helical structure of conductors through which the electric current circulates. (D) Detail of the concentric layers of Teflon and Alloy on which the geometry of the computational model was based (E).
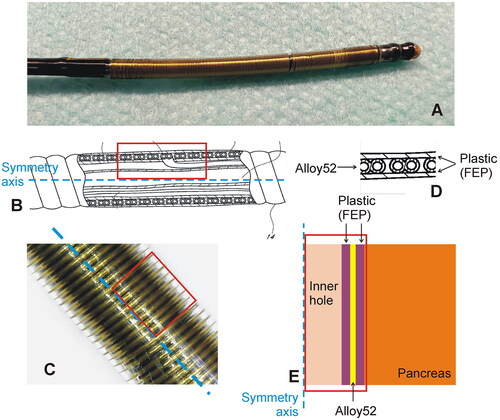
Table 1. Physical characteristics of tissues and materials of each element used in the model.
Figure 2. Animal model. Endoluminal thermal ablation of the main pancreatic duct (MPD) conducted using the ClosureFast® system (Medtronic, Mansfield, MA, USA). SL: splenic lobe; DL: duodenal lobe; CL: connecting lobe (CL); B: Bridge. Note that the connecting lobe and bridge are present in the pig anatomy but not in the human pancreas.
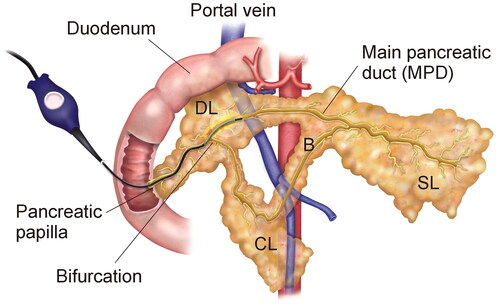
Figure 3. Clinical results. Serum lypase concentration throughout the postoperative period in patients after TAMPD. Note that the slight increase of first day is followed by a rapid decrease afterward.
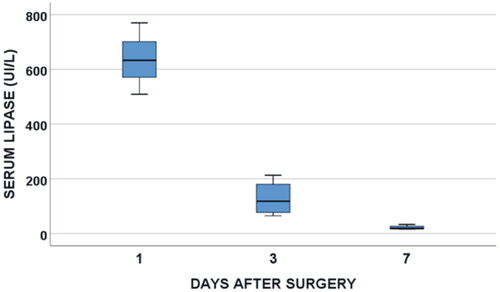
Figure 4. Clinical results. Typical CT images before (A), 7 days (B) and 30 days after TAMPD (C). Both the transverse diameter of the remaining pancreas (clear bar) and maximum diameter of the MPD (green arrow) increased at 7-day PO and then reduced at 30-day PO.
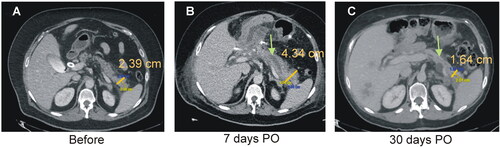
Figure 5. Clinical results. Post-operative progress of the transverse diameter of the remnant pancreas thickness (A,B) and maximum diameter of the main pancreatic duct (MPD) (C,D) in eight patients treated with thermal ablation of the MPD. Each patient is represented by a single-color line in left panels, while mean values (optimized scale) are shown in right panels. Note that the steep increase of pancreas diameter within the first week is followed by more slow decrease afterward. Interestingly, the final measurements of the pancreas diameter are below the initial values in all cases, which is consistent with pancreas atrophy of the stump. A similar behavior was observed in the MPD maximum diameter.
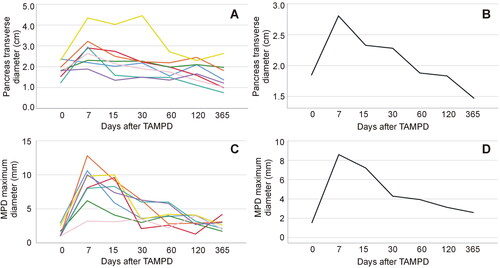
Figure 6. Computer results. (A) Temperature progress at several points of the model (1: inner conductors; 2: surface of the catheter; 3: at 0.45 mm from the surface; 4: at 1 mm from the surface). (B) Temperature distributions at 20 s in the catheter and pancreas. (C) Detail of the temperature in the proximity of the catheter, showing the position of the points where the temperature is plotted in Panel (A).
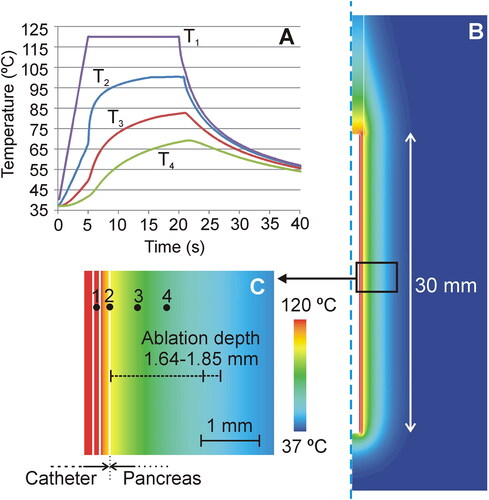
Table 2. Study variables before and after thermal ablation of main pancreatic duct.
Figure 7. Animal model results. (A) Fluoroscopic image obtained during of the duct permeability test in 0-day Group. Iodinated contrast was injected through the MPD in anterograde, i.e. through papilla (yellow solid line), showing extravasation of the MPD in all cases (blue arrows), including the connecting lobe (CL). (B–D) Fluoroscopic images obtained in 7-day Group. While some animals showed MPD maintained patency when contrast was injected in an anterograde manner via the papilla (yellow solid line), i.e. the contrast occupied almost the entire length of the main duct and part of the connecting lobe (CL) (B), in other animals, the MPD was totally obstructed (red line) and the contrast was thus redirected toward the connecting lobe (C). In these animals, obstruction was confirmed when contrast was injected in a retrograde manner (yellow dashed line), i.e. from the most distal part of MPD (pancreas tail) (D). (F,G,I,J) Fluoroscopic images in 30-day Group. Although complete occlusion of the MPD was observed in all animals (red line represents the duct interruption), the injected contrast course revealed the relative position of the thermal ablation zone with respect to the bifurcation of the connecting lobe (secondary duct). (E–G) In some animals (e.g., 30d-5) anterograde (yellow solid line) and retrograde (yellow dashed line) injections of contrast suggested that the proximal limit of the thermal ablation zone was possibly before the bifurcation (as illustrated in (E)). (H–J) In other animals (e.g., 30d-4) anterograde and retrograde injections suggested that the proximal limit of the thermal ablation zone was possibly posterior to the bifurcation (as illustrated in (H)).
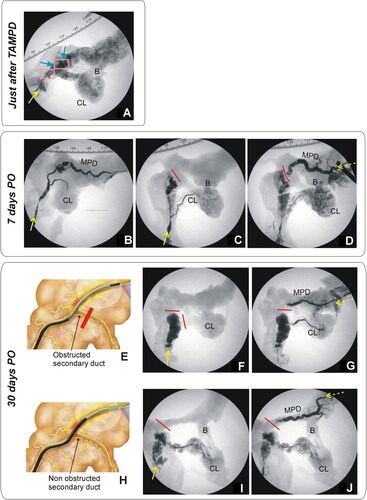
Figure 8. Animal model results. Histopathological findings of 0-day Group. (A,B) Macroscopic view of the main pancreatic duct (MPD) surrounded by a whitish and an erythematous halo. (C–F) Microscopic image (H&E): MPD with wall collagen necrosis (MPDcn) surrounded by three zones: Coagulation necrosis (CN) with intense zymogen granules eosinophilia (D), congestion (C) with disaggregated acini (E) and normal tissue (NT) (F). Scale in mm.
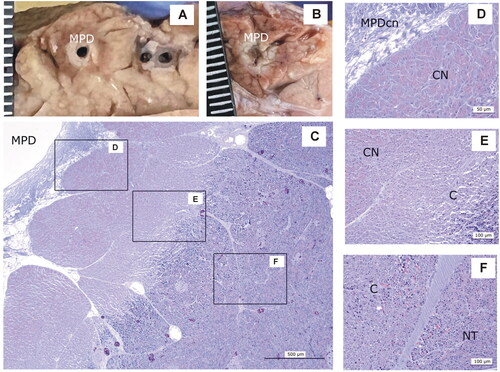
Figure 9. Animal model results. Histopathological findings of Group 7-day. (A) Macroscopic view of the main panreatic duct (MPD) showing a large cavity (MPDc) with irregular brown margins. (B − E) Microscopic image (H&E). (C) Cavity with cellular debris and amorphous material (MPDc), complete exocrine atrophy (EA); (D) Fibrous tissue (FT) Langerhans islets preserved (LI). (E) Lobules with complete or partial exocrine atrophy (EA) and lobules without lesions (NT). Scale in mm.
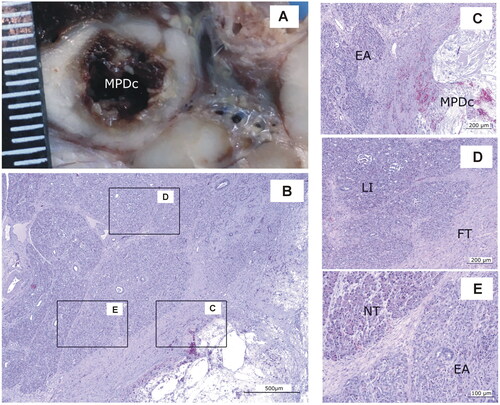
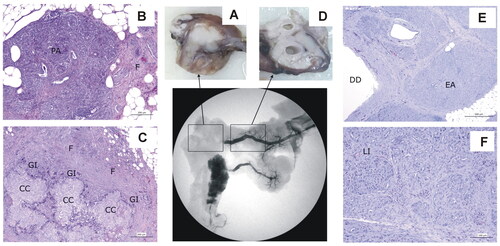
Figure 10. Animal model results. Histopathological findings of Group 30-day, distinguishing the ablation zone (A–C) and the distal zone (D − F). (A) Macroscopic view of the ablation zone. (B,C) Histological image (H&E). (B) Residual pancreatic tissue (PA) tissue with intense fibrosis (F). (C) Granulomas with cholesterol crystals (CC) surrounded by a granulomatous infiltrate (GI), with macrophages and giant cells and intense fibrosis (F). (D) Macroscopic view of distal portion in the main pancreas showing ducts dilation. (E,F) Histological image (H&E). (E) Ducts dilatation (DD) and complete and homogeneous exocrine atrophy (EA). (F) Langerhans islets (LI) preservation.
Data availability statement
The data underlying this article will be shared on reasonable request to the corresponding author.