Figures & data
Figure 1. A wireframe rendering of the MIH model.
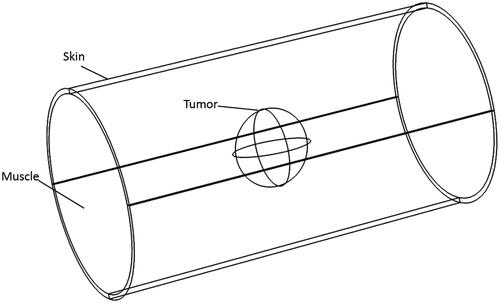
Figure 2. (a) The XRD pattern of Fe83Zr10B7. (b) The magnetic hysteresis loop of Fe83Zr10B7. (c) The thermogravimetric curve obtained by thermogravimetric analyzer under a static magnetic field, the inset is the first derivative of the thermogravimetric curve. (d) The M-T curve obtained by PPMS, the inset is the first derivative of the M-T curve.
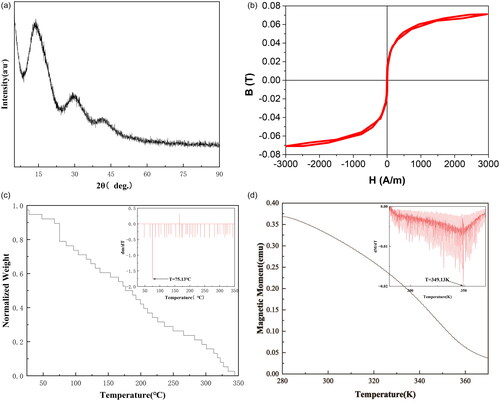
Table 1. Physical parameters.
Table 2. Fe83Zr10B7 parameters.
Figure 3. (a) The experimental scheme for measuring heating curves of Fe83Zr10B7 rectangular. (b) Cylindrical fresh pork tissue and Air-core copper coil used in MIH experiment. (c) Diagram of in vitro tissue experiment.
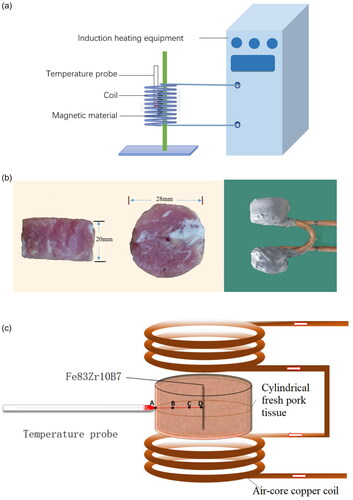
Figure 4. The three-dimensional heating model.
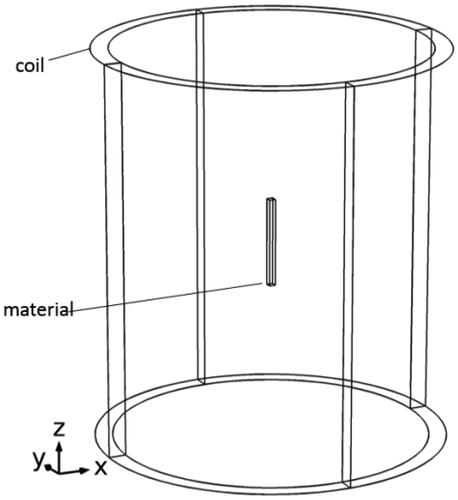
Figure 5. The comparison of the surface temperature of Fe83Zr10B7 rectangular between simulation and experimental results under different heating conditions at f = 60kHz.
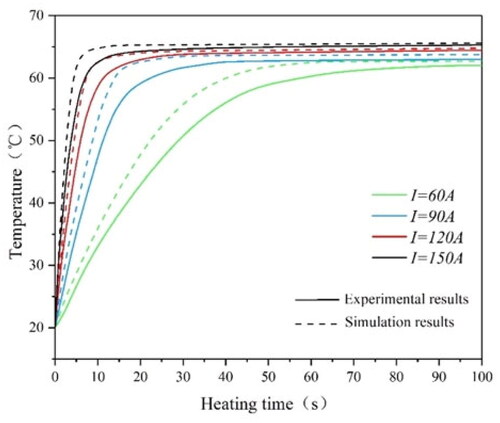
Figure 6. Simulation and experimental temperature rise curves of four temperature measuring points in fresh pork tissue.
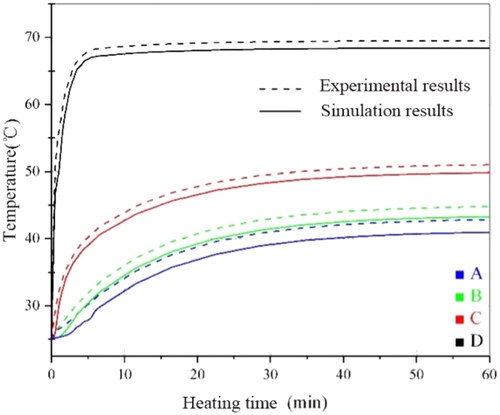
Figure 7. The angle between the direction of the applied magnetic field and the central axis of the cylindrical and the rectangular varies from 0° to 90°.
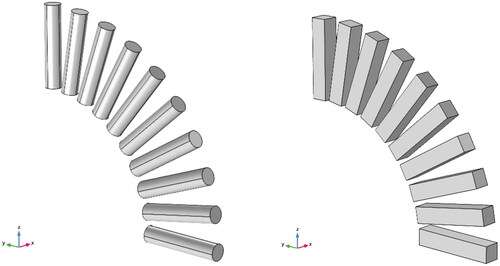
Figure 8. The initial average heating power density of three shapes of Fe83Zr10B7 material with various angles at f = 90kHz, H0=5kA/m and T = 37 °C.
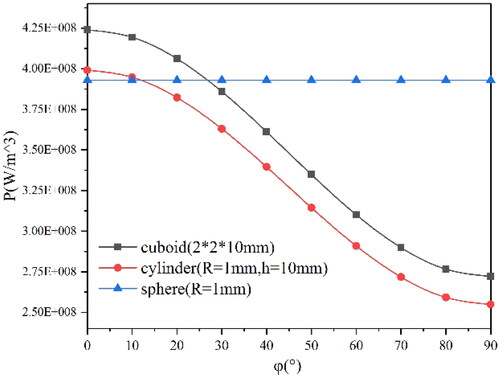
Figure 9. The induced current density distribution of a Fe83Zr10B7 cuboid at f = 90kHz, H0=5kA/m.
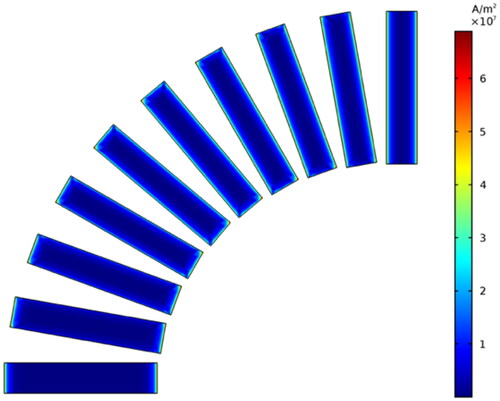
Figure 10. The initial heating power density of a Fe83Zr10B7 cylinder with a radius of 1 mm.
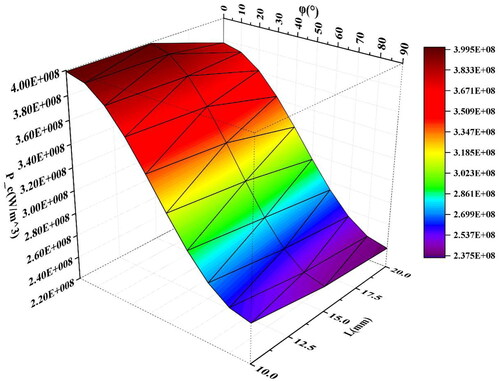
Figure 11. The heating power density of Fe83Zr10B7 spherical.
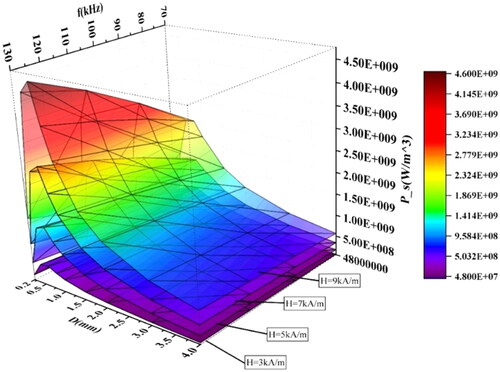
Figure 12. The heating power of Fe83Zr10B7 spherical.
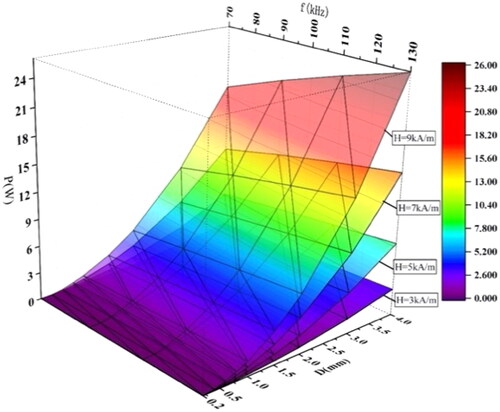
Figure 13. Temperature distribution along the radius from the tumor center under the conditions of f = 90kHz and H0=9kA/m of magnetic media with various diameters.
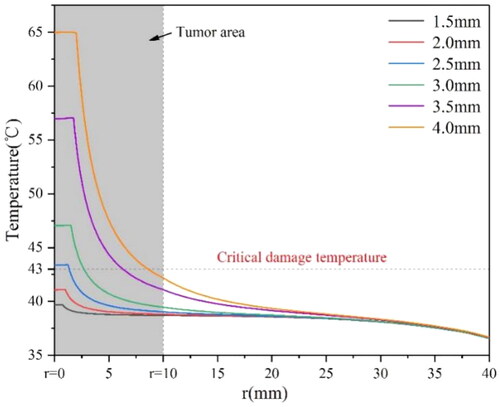
Figure 14. The arm model of the human body.
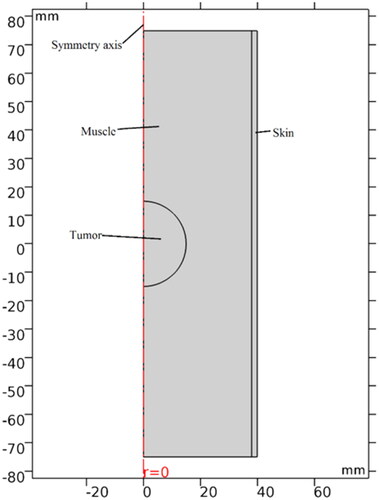
Figure 15. The temperature distribution in normal tissue and tumor under the condition of f = 240kHz and H0=15kA/m for 60 min.
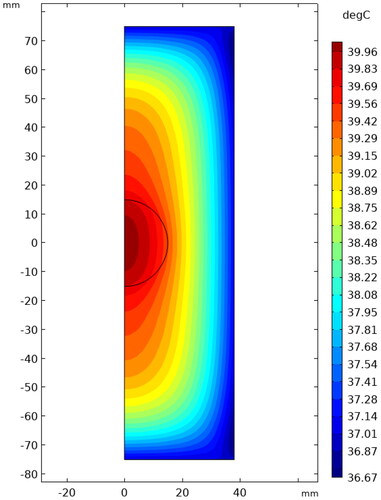
Figure 16. The equivalent thermal dose curves of tissue under different magnetic field conditions.
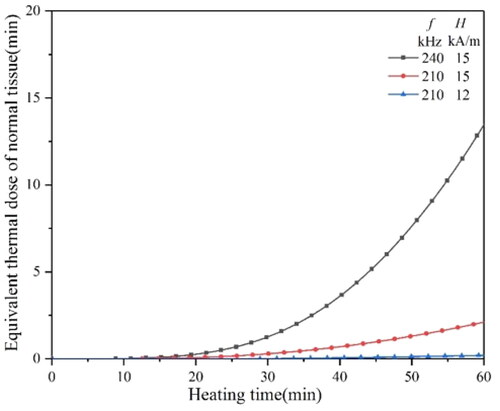
Figure 17. The equivalent thermal dose curves of a 10 mm diameter tumor heated by a 3.5 mm diameter material under different magnetic conditions.
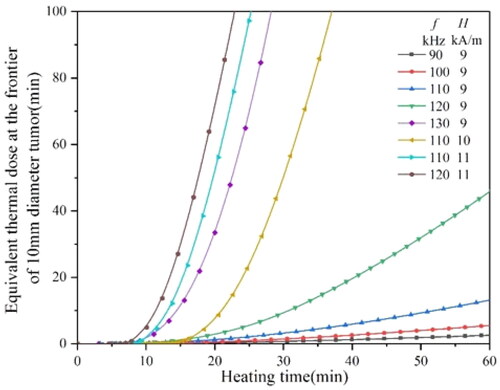
Figure 18. The equivalent thermal dose curves of a 20 mm diameter tumor heated by a 4 mm diameter material under different magnetic field conditions.
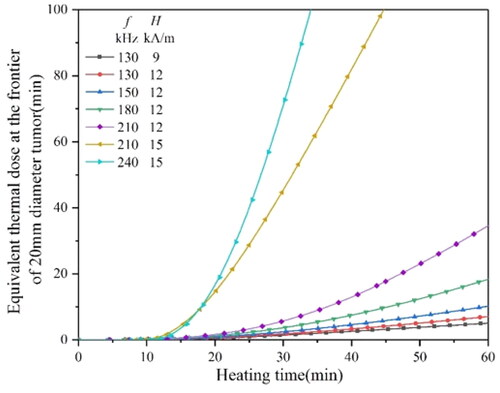
Figure 19. The heating model arranged by six spherical magnetic mediums.
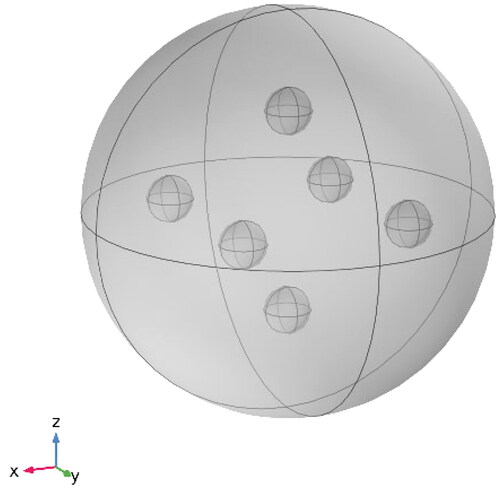
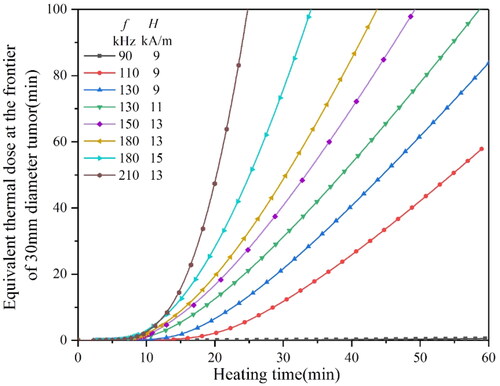
Figure 20. The equivalent thermal dose curves of a 30 mm diameter tumor heated by six spherical magnetic mediums under different magnetic conditions.