
Figures & data
Table 1. Correlation between social demography and vaginal microecology [n (%)].
Table 2. Comparison of the function of H2O2 negative rate and the density and diversity of vaginal flora at the time of admission and one week after drug treatment [n (%)].
Table 3. Comparison of PH value and the proportion of Lactobacillus between at the time of admission and one week after drug treatment [± s].
Table 4. Comparison of normal rate of vaginal flora at the time of admission and 3 months after FU[n (%)].
Table 5. Comparison of vaginal flora density and diversity at the time of admission and 3 months after FU [n (%)].
Table 6. Comparison of abnormal vaginal secretions at the time of admission and 3 months after FU[n (%)].
Table 7. Comparison of abnormal vaginal microenvironment at the time of admission and 3 months after FU[± s].
Figure 1. Study flowchart.
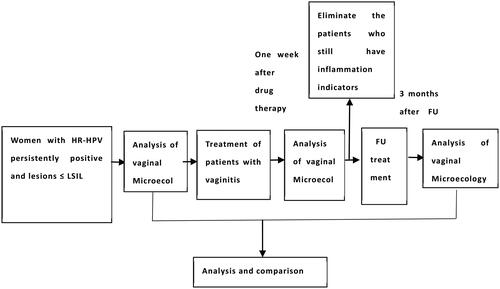
Figure 2. Images of patients with acute vaginitis when at the time of admission、one week after drug therapy and 3 months after FU treatment.
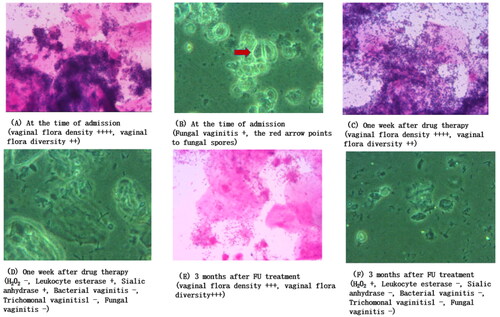
Table 8. Comparison of HPV positive rate in different vaginal microecological groups at the time of admission and 3 months after FU[n(%)].
Table 9. Socio-demographic analysis of people with different vaginal microecological conditions.