
Figures & data
Figure 1. Sagittal T2-weighted images of adenomyosis and enhanced MR images with different non-perfused volume ratios (NPVR) after HIFU treatment. In a 38-year-old patient, the volume of the adenomyotic lesion was 61.2 cm3 (A1) and the non-perfused volume (NPV) was 45.3 cm3 (A2). The NPVR was 74.0%. In a 32-year-old patient, the volume of the adenomyotic lesion was 57.4 cm3 (B1) and the non-perfused volume (NPV) was 20.6 cm3(B2). The NPVR was 35.9%.
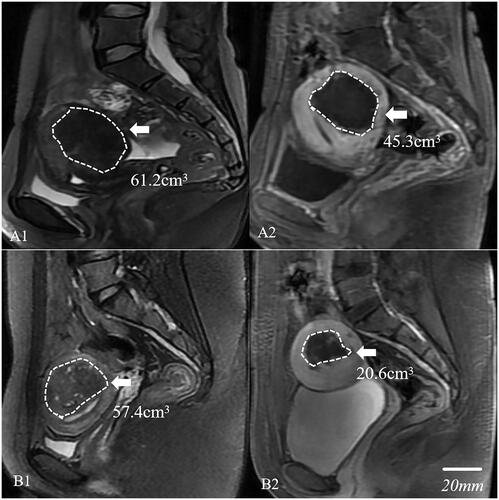
Table 1. Comparison of intraprocedural adverse effects between NPVR ≥50% group and NPVR < 50% group.
Table 2. Comparison of postprocedural complications between NPVR ≥ 50% group and NPVR < 50% group.
Table 3. Comparison of characteristics and ultrasound ablation results between two groups.
Figure 2. Comparison of the degree among the factors influencing the non-perfused volume ratio (NPVR) ≥50%. AWT: Abdominal wall thickness; T1WI: Enhancement type on T1WI; T2WI: SI difference on T2WI between adenomyosis and rectus abdominis.
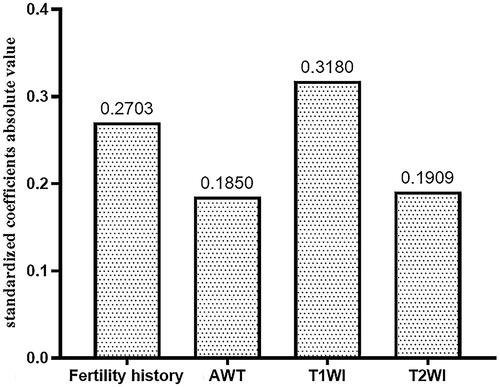
Table 4. The binary logistic regression analysis of variance.
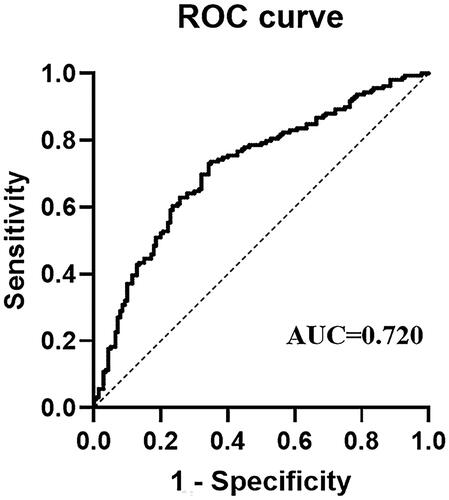
Figure 3. The receiver operating characteristic (ROC) curves of the prediction model in predicting the non-perfused volume ratio (NPVR) ≥ 50%.
Supplemental Material
Download PDF (965.6 KB)Data availability statement
The data that support the findings of this study are available on request from the corresponding author. The data are not publicly available due to their containing information that could compromise the privacy of research participants.