
Figures & data
Figure 1. (A) The intrarectal Foley catheter was in the rectum without degassed water injection. The lesion was off range, which was infeasible for HIFU. (B) The degassed water balloon of the intrarectal Foley catheter moved the uterus forward, and the lesion was in range. (C) The Foley catheter used in the present study (Weili Medical Device Co., LTD, Guangzhou, China). (D) The end balloon was filled with degassed water. This was used to fix the catheter in the bladder. (E) The size of the degassed water balloon was 60 mm × 45 mm, which could move the uterus 22.5 mm forward to the abdominal wall. *The green square in A and B is the range square of the HIFU treatment range.
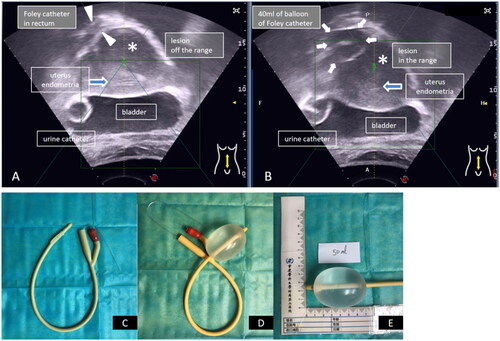
Figure 2. The flow diagram.
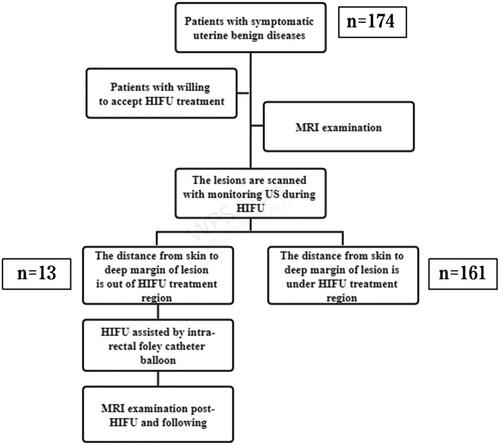
Figure 3. MR images of the lesion on T2WI: (A) and (C) are pretreatment images; (B) and (D) are post-HIFU images. Contrast-enhanced MR images of the lesion on T1WI: (E) pretreatment image in the arterial phase, (G) and (I) pretreatment images in the venous phase; (F) post-HIFU image in the arterial phase, (H) and (J) post-HIFU images in the venous phase.
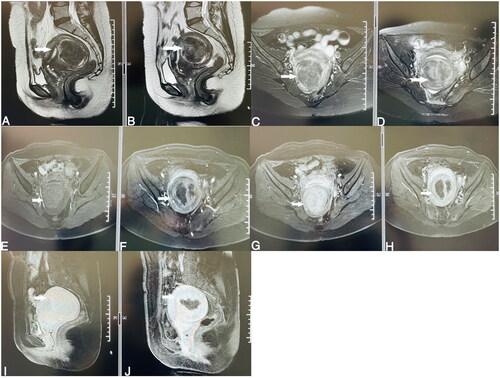
Table 1. Baseline characteristics of patients and lesions.
Table 2. Treatment results of patients treated by HIFU.
Data availability statement
The data that support the findings of this study are available from the corresponding author, K.Z., upon reasonable request.