
Figures & data
Figure 1. Flow chart of patients’ inclusion and exclusion criteria.
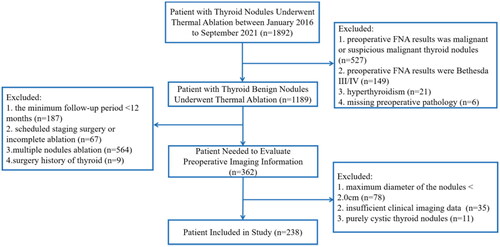
Table 1. The variables included in logistic regression model and definition.
Table 2. Demographic and clinical information of patients.
Figure 2. Forest plot of multivariate logistic regression for volume reduction rate ≥75.0% in benign thyroid nodules after thermal ablation.
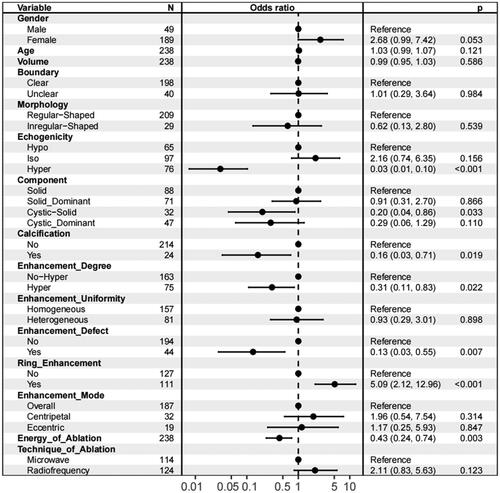
Figure 3. A nomogram to predict the probability of volume reduction rate ≥75.0% in benign thyroid nodules after thermal ablation at 12-month follow-up.
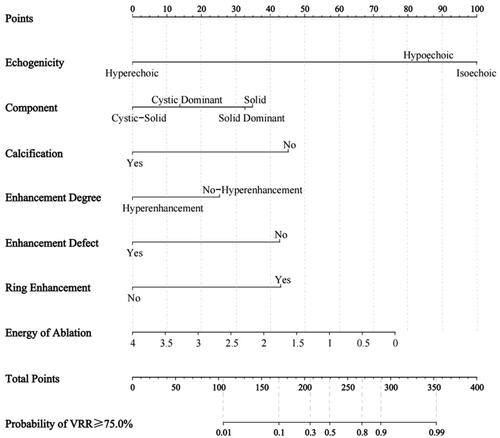
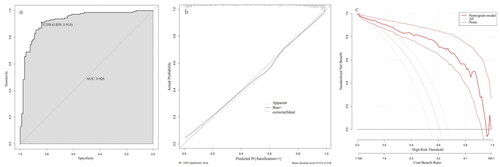
Figure 4. (a) The receiver-operating characteristics curve of the nomogram, the AUC was 0.926. (b) The calibration curve of the nomogram. (c) The decision curve analysis (DCA) of the nomogram.
Data availability statement
The datasets used and/or analyzed during the current study are available from the corresponding author upon reasonable request.