
Figures & data
Figure 1. Histotripsy reduces tumor viability and is a safe procedure. A) Experimental setup for histotripsy bubble cloud generation. Histotripsy pulses of 2-cycle duration and 35 MPa peak negative pressure were applied to a NB orthotopic murine model with a 1-MHz focused source. A coaxial imaging probe ensured bubble clouds were contained within the tumor as shown in inset, where histotripsy pulses propagated from top to bottom. The focused source was translated along the tumor with motorized stages. The streaks are constructive interference between the imaging and therapy pulses. Bar represents 1 cm. B) Representative images of luciferase tumor radiance measured at baseline, immediately after, and 24 h after histotripsy on IVIS or at equivalent time points for untreated controls. Red arrowheads point at the luciferase decrease after histotripsy. C) Radiance of Untreated controls (blue bars) had no significant change in radiance over 24 h (p = 0.8, n = 7) while radiance decreased by over 50% compared to baseline after histotripsy (green bars, p = 0.03, n = 7). Luciferase had not returned to baseline 24 h after treatment. Graph represents mean ± standard deviation. D) Treated mice lost less than 10% body weight compared to their pre-histotripsy weight over 24 h (p = n/s, n = 7). *=p < 0.05.
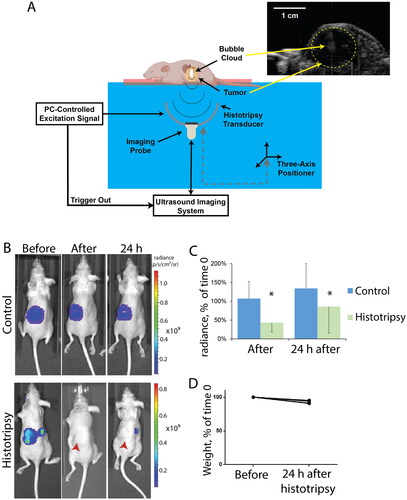
Figure 2. Histotripsy induces fractionation and apoptosis directly as well as via TNFα 24 h after treatment. A) Representative images of the apoptosis marker TUNEL in controls (left panels) and histrotripsy-treated tumors (right panels), shown at low magnification (top row, bar = 1mm) or high magnification of white box (bottom row, bar = 200µm). Histotripsy resulted in a fractionated area devoid of nuclei denoted by *, bottom right panel), and surrounded by a rim of TUNEL-positive cells ‘Direct effect’. Tumor regions distant from the ablation site also had more TUNEL-positive cells (labeled ‘Indirect effect’) than controls. B) Direct apoptosis (areas adjacent to fractionation) was 28% higher in histotripsy (p < 0.0001). Apoptosis also increased 2.5-fold in Indirect areas (p = 0.02). C) SDS-PAGE of untreated controls vs histrotripsy-treated tumors under denaturing conditions reveals that histotripsy induced a four-fold increase in TNFα relative to controls, both full-length (25 kDa) as well as soluble forms (17 kDa) (lanes 1-6 are control tumors; lanes 7-12 are histrotripsy-treated tumors); graph quantifies both forms normalized to β-actin housekeeping gene as a % of controls (p < 0.05, n = 6 per group). D) Representative sections of c-casp-3 (green) in control or histotripsy-treated tumors: histotripsy increased c-casp-3 in tumor cells within Indirect areas (arrowhead). E) SDS-PAGE of tumor protein extracts revealed that histotripsy induced a four-fold increase in c-casp-3 (19 kDa) compared to controls (p < 0.05, n = 6 per group) (Lanes 1-6 are control tumors; lanes 7-12 are histrotripsy-treated tumors) Graph quantifies c-casp-3 normalized to beta actin housekeeping gene as a % of controls. *=p < 0.05. All graphs represent means and standard deviation.
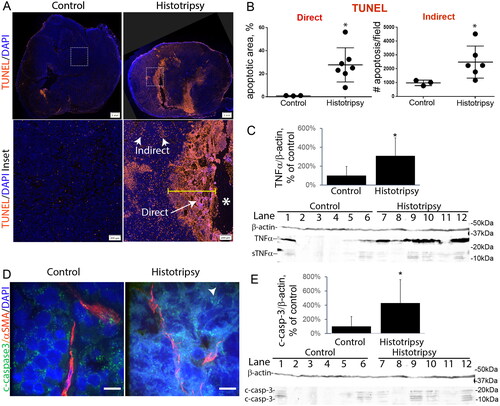
Figure 3. Histotripsy reduces hypoxia and VEGF in NGP xenografts 24 h post-treatment. A) Control tumors display regions that stain for the hypoxia marker pimonidazole (dark brown, arrowheads, bar = 1mm), while histotripsy resulted in its absence. B) VEGF expression is upregulated by hypoxia; representative images of control tumors with high VEGF (red, arrowheads) adjacent to endomucin-positive endothelial cells (green), while VEGF was reduced in histrotripsy-treated tumors (bar = 10µm). C) VEGF levels were signifcantly lower in histrotripsy-treated tumors compared to controls (p < 0.001, n = 4), confirming decreased hypoxia. Graphs represent means and standard deviation. **=p < 0.01.
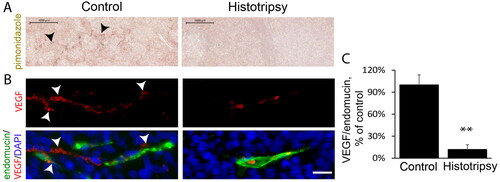
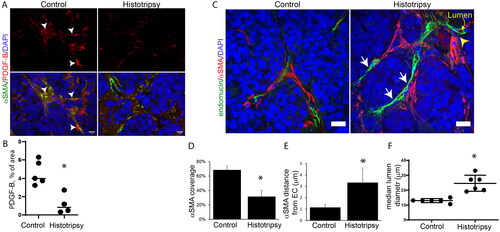
Figure 4. Histotripsy reduces pericyte coverage and induces vasodilation in NGP xenografts 24 h after treatment. A) Representative images of the VEGF target and pericyte recruitment ligand PDGF-B (red, arrowheads), lower in histrotripsy-treated tumors than controls. B) Quantification of PDGF-B ligand stains depicts lower PDGF-B levels as a result of histotripsy (p < 0.05, n = 4). C) Z-stacks captured with confocal microscopy shown as a 2D projection of the endothelial marker endomucin (green), the pericyte marker α-SMA (red) and nuclear DAPI stain (blue). Endothelial cells of untreated control tumors have a continual coverage of α-SMA pericytes lining (left panel). In contrast, histotripsy resulted in endothelial cells (green) lacking pericyte coverage (red), as well as higher separation between remaining pericytes and endothelial cells (yellow arrowhead). Scale bar: 10 µm. D) Quantification shows decreased endothelial cells (green) surrounded by neighboring α-SMA positive pericytes (red), p = 0.001). E) Pericytes distance from endothelium increases 3-fold after histotripsy (p < 0.01). F) Median vascular lumen of histrotripsy-treated tumors was two-fold wider than untreated controls, p < 0.01). *=p < 0.05. Graphs D and E represent means and standard deviation, B and F represent medians.
Data availability statement
All data and protocols are available: 10.6084/m9.figshare.22557934.