
Figures & data
Figure 1. The generalized simulation scheme: (a) Geometry of an MNW and the resulting magnetic moment map, where (i) shows the basic shape information of an MNW and a cell, (ii) and (iii) gives an example of resulting magnetic moment map in 3D and 2D respectively; (b) The coordinate system including direction of applied field H and color-coded directions for the magnetic moment.
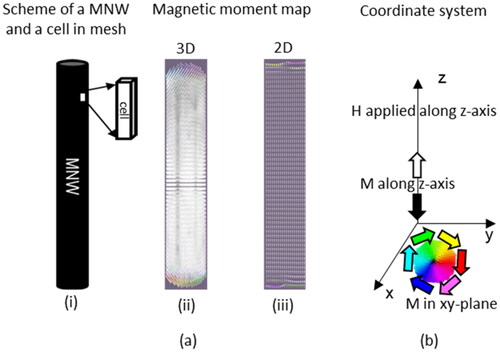
Table 1. Exchange parameter (A), saturation magnetization (Ms), shape anisotropy (Km) and critical diameter (Dc) specified for different materials used in this study.
Figure 2. (a) Hysteresis loops of Fe MNWs with diameters of 50 nm (blue with diamond), 100 nm (red with square) and 200 nm (black with dot) showing the inverse relationship between loop area and MNW size. The inlet figure on the left shows how the external field (red) switches the moment(black) within an MNW. (b) 2D snapshots of the magnetic moments at fields just smaller than the coercivity of Fe MNWs with (i) 50 nm diameter and (ii) 100 nm diameter. The black arrow indicates the length of the vortex domain walls. (c) 2D snapshots of the magnetic moments of the Fe MNW with 200 nm diameter at (iii) H < H1 before the curling cores switch down and (iv) H < H2 before the curling ‘shells’ switch down. [Note: aspect ratios in 2D snapshots are not to scale for easier visualization].
![Figure 2. (a) Hysteresis loops of Fe MNWs with diameters of 50 nm (blue with diamond), 100 nm (red with square) and 200 nm (black with dot) showing the inverse relationship between loop area and MNW size. The inlet figure on the left shows how the external field (red) switches the moment(black) within an MNW. (b) 2D snapshots of the magnetic moments at fields just smaller than the coercivity of Fe MNWs with (i) 50 nm diameter and (ii) 100 nm diameter. The black arrow indicates the length of the vortex domain walls. (c) 2D snapshots of the magnetic moments of the Fe MNW with 200 nm diameter at (iii) H < H1 before the curling cores switch down and (iv) H < H2 before the curling ‘shells’ switch down. [Note: aspect ratios in 2D snapshots are not to scale for easier visualization].](/cms/asset/bba3ac81-2f24-48fe-96cf-5a55661f7476/ihyt_a_2223371_f0002_c.jpg)
Figure 3. Hysteresis loops (using magnetization in z direction, Mz in [kA/m]) of Py (yellow with triangle), Co (black with dot), Ni (blue with diamond) and Fe (red with square) MNW with a diameter of 50 nm.
![Figure 3. Hysteresis loops (using magnetization in z direction, Mz in [kA/m]) of Py (yellow with triangle), Co (black with dot), Ni (blue with diamond) and Fe (red with square) MNW with a diameter of 50 nm.](/cms/asset/fc9d5963-81fc-41f6-bb0a-5dec54889f9c/ihyt_a_2223371_f0003_c.jpg)
Table 2. Summary of theoretical specific loss power (SLP) for different materials and sizes studied. For typically available AMF systems (80 kA/m field limit), the optimal achievable SLP was achieved by Co MNW with 50 nm diameter (red). A frequency of 50 kHz was used for all calculations.
Figure 4. Hysteresis loops of Co (black with dot), Fe (red with square), Ni (blue with diamond), Py (yellow with a triangle) MNWs with small diameter (10 nm).
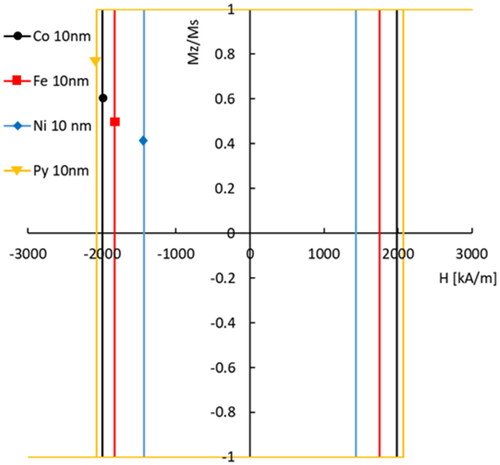
Figure 5. Correlation between the coercivity Hc in kA/m and the normalized diameter D/Dc for MNWs with different materials (black dot for Co, red square for Fe, blue diamond for Ni and yellow triangle for Py). Log axis is chosen to clearly show the ∼ D−2 relationship that is expected for VDW reversal [Citation39].
![Figure 5. Correlation between the coercivity Hc in kA/m and the normalized diameter D/Dc for MNWs with different materials (black dot for Co, red square for Fe, blue diamond for Ni and yellow triangle for Py). Log axis is chosen to clearly show the ∼ D−2 relationship that is expected for VDW reversal [Citation39].](/cms/asset/224c4c07-abda-4fec-9a33-2ccb3087c16f/ihyt_a_2223371_f0005_c.jpg)
Supplementary Material
Download MS Power Point (26.6 MB)Data availability statement
The data that support the findings of this study are openly available in Figshare at https://doi.org/10.6084/m9.figshare.22040795.v1.