
Figures & data
Table 1. Baseline characteristics before and after propensity score matching, n (%).
Figure 1. Kaplan–Meier curves of PC. (A) thermal ablation versus non-ablation for OS after PSM; (B) thermal ablation versus non-ablation for LCSS after PSM. PC: pulmonary carcinoid; OS: overall survival; LCSS: lung cancer-specific survival; PSM: propensity score matching.
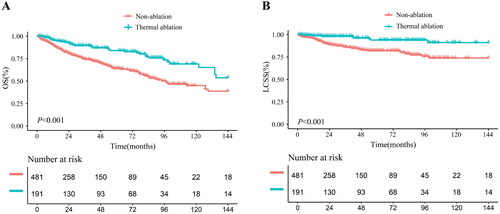
Figure 2. Kaplan–Meier curves of PC. (A) thermal ablation versus non-ablation for OS of patients aged ≤70 years after PSM; (B) thermal ablation versus non-ablation for LCSS of patients aged ≤70 years after PSM; (C) thermal ablation versus non-ablation for OS of patients aged >70 years after PSM; (D) thermal ablation versus non-ablation for LCSS of patients aged >70 years after PSM. PC: pulmonary carcinoid; OS: overall survival; LCSS: lung cancer-specific survival; PSM: propensity score matching.
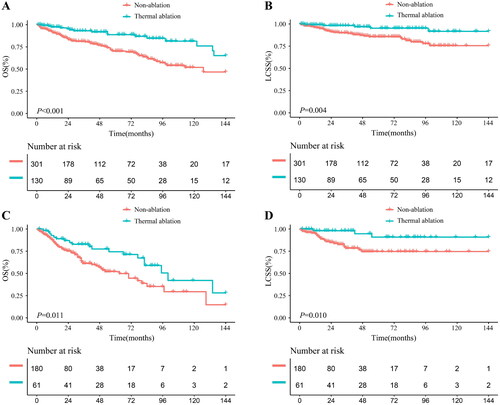
Figure 3. Kaplan–Meier curves of PC. (A) thermal ablation versus non-ablation for OS of female patients after PSM; (B) thermal ablation versus non-ablation for LCSS of female patients after PSM; (C) thermal ablation versus non-ablation for OS of male patients after PSM; (D) thermal ablation versus non-ablation for LCSS of male patients after PSM. PC: pulmonary carcinoid; OS: overall survival; LCSS: lung cancer-specific survival; PSM: propensity score matching.
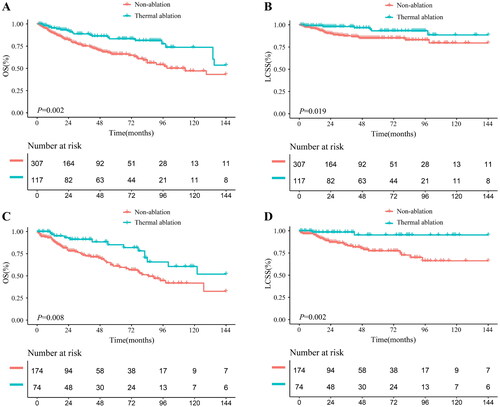
Figure 4. Kaplan–Meier curves of PC. (A) thermal ablation versus non-ablation for OS of TC patients after PSM; (B) thermal ablation versus non-ablation for LCSS of TC patients after PSM; (C) thermal ablation versus non-ablation for OS of AC patients after PSM; (D) thermal ablation versus non-ablation for LCSS of AC patients after PSM. PC: pulmonary carcinoid; TC: Typical carcinoid; AC: atypical carcinoid; OS: overall survival; LCSS: lung cancer-specific survival; PSM: propensity score matching.
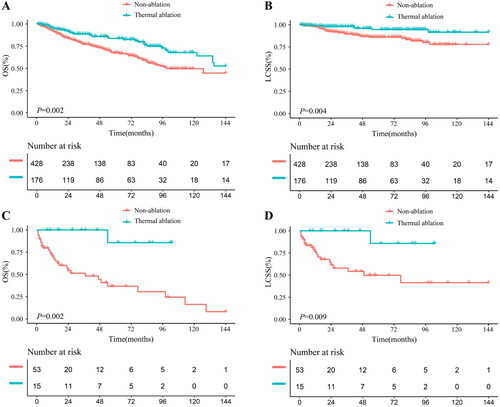
Figure 5. Subgroup analysis for OS (A) and LCSS (B) in the matched population. OS: overall survival; LCSS: lung cancer-specific survival.
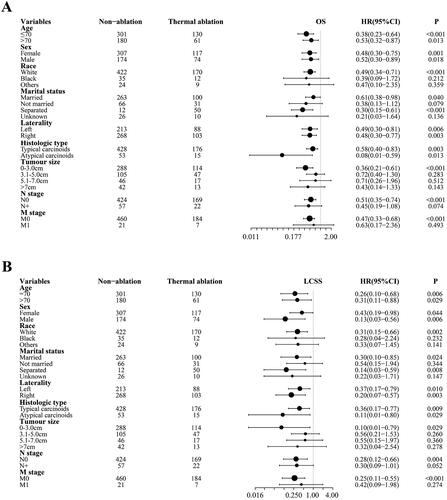
Table 2. Univariable and multivariable analysis for overall survival in the whole cohort.
Table 3. Univariable and multivariable analysis for lung cancer-specific survival in the whole cohort.
Supplemental Material
Download PDF (183.9 KB)Data availability statement
All SEER data and information are publicly available at https://seer.cancer.gov/.