
Figures & data
Figure 1. Flowchart of patient recruitment (A and B).
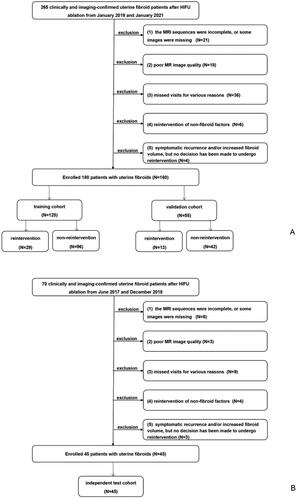
Figure 2. Flowchart of radiomics analysis.
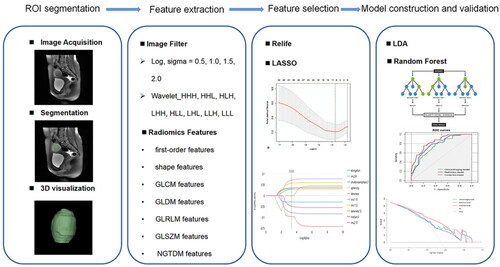
Figure 3. A 40-year-old patient with a uterine fibroid (white arrow). The fibroid volume before ablation was 181,567.960 mm3, and the residual fibroid volume after ablation was 76,321.690 mm3. The NPVR value was 58.0%. Thirty months after HIFU ablation, this patient underwent a repeat hysteroscopic myomectomy for lack of symptom relief. (A) Before HIFU ablation, the fibroid showed homogeneous hyperintense on the T2WI-FS image. (B) The fibroid showed obvious homogeneous enhancement on the late arterial image. (C) Late arterial images after HIFU ablation showed no enhancement in the ablated area.
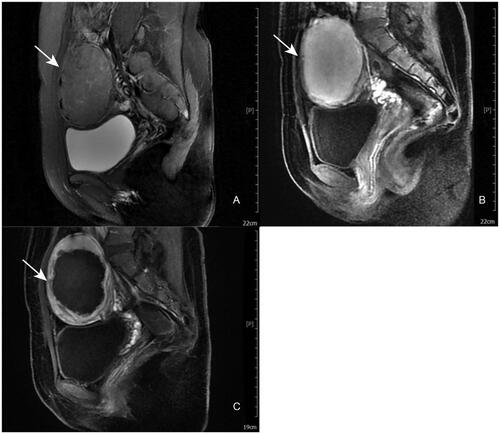
Table 1. Clinical-imaging features of the training and validation cohorts.
Table 2. Independent predictors for reintervention risk.
Table 3. Clinical-imaging features of the independent test cohort.
Figure 4. Receiver operating characteristic (ROC) curves of the clinical-imaging mode, radiomics model and combined model in the training (A) and validation (B) cohorts.
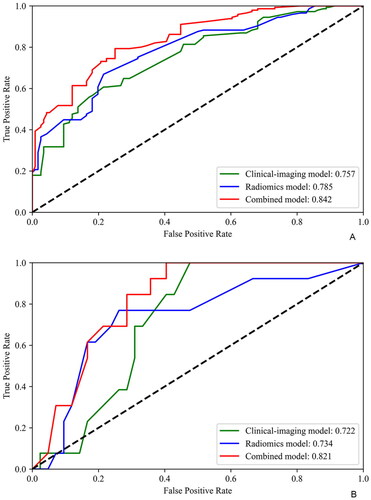
Figure 5. Receiver operating characteristic (ROC) and precision-recall curves of the combined model in the independent cohort (A and B).
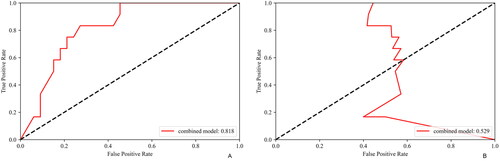
Table 4. Predictive performance of the clinical-imaging, radiomics and combined models.
Table 5. Comparison of the model’s predictive performance.
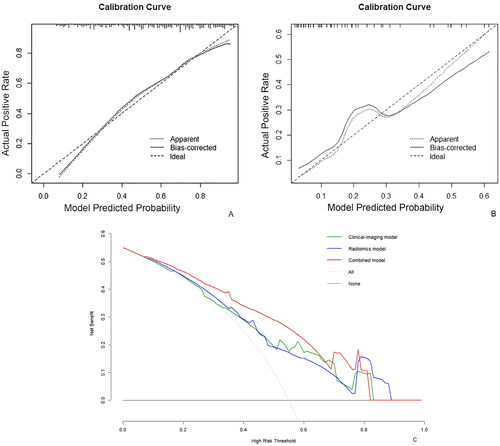
Figure 6. Evaluation and verification of the combined model. (A, B) calibration curves for the combined model regarding the agreement between predicted and actual reintervention risk in training (A) and validation (B) cohort. The x-axis represents the probability predicted by the combined model, and the y-axis represents the actual probability. The perfect prediction corresponds to the thick black dashed line. The thin black dashed line indicates the entire cohort, and the solid black line is bias-corrected by bootstrapping (1000 repetitions), showing the observed combined model performance. (C) Decision curve analysis for the combined model. The thick black line represents the net benefit of assuming no fibroid patients receive HIFU ablation. The thin black line is the net benefit of taking that all fibroid patients receive HIFU ablation. The green, blue and red lines represent the expected net benefit of predicting the risk of reintervention using the clinical-imaging, radiomics and combined models.
Supplemental Material
Download PDF (283.2 KB)Data availability statement
The data used to support the findings of this study are available from the corresponding author upon request.