
Figures & data
Figure 1. Short-term and long-term results of different treatments. (A, B) Uterine (A) and lesion (B) volume before and after different treatments at different follow-up times. (C, D). SQC (C) and VAS (D) before and after different treatments at different follow-up times.
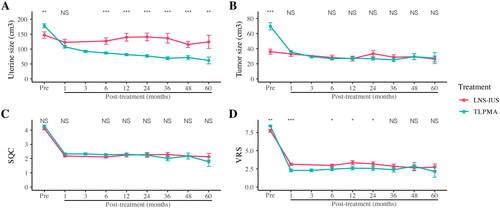
Table 1. Baseline information before treatment.
Table 2. Uterine volume, lesion volume, SQC and VAS score before and after different treatments.
Figure 2. Laparoscope images before ablation. (A) Laparoscope image shows adhesions; (B) Laparoscope image shows the safe space and observation field for the ablation; (C) Laparoscope image shows the blood vessels in the abdominal wall during the needle insertion process.
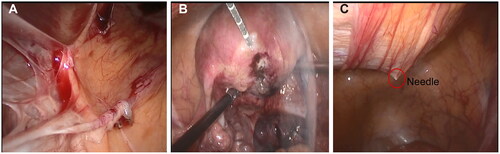
Figure 3. Laparoscope images during ablation. (A) Laparoscope image shows the color changes of the uterine surface; (B) Laparoscope image shows the cotton yarn heat insulation to get a safe space; (C) Laparoscope image shows a clean wound surface during ablation.
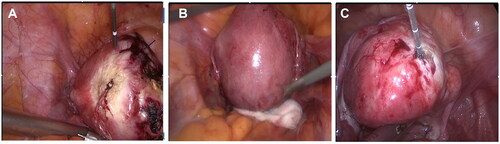
Figure 4. Laparoscope images after ablation. (A) Laparoscope image shows the process of flushing the wound and cleaning the field of vision; (B) Laparoscope image shows the process of checking the condition of the uterus and surrounding organs after ablation.
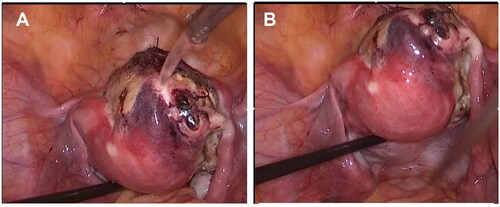
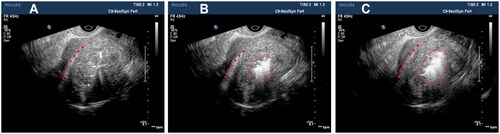
Figure 5. Transvaginal ultrasound images of the uterus. (A–C) Hyperechogenic signal under transvaginal ultrasound guidance indicates the ablation area, and the scope of the hyperechogenic signal becomes more and more larger. The red dots: the direction of the endometrium; the long arrow: the position of the ablation needle path; the short arrow: the position of the needle tip; the red circle: the range of ablation gasification and with the continuous progress of ablation, the range of strong echo gasification gradually increases.
Supplemental Material
Download Zip (490.4 KB)Data availability
The authors confirm that the data supporting the findings of this study are available within the article and its supplementary materials.