
Figures & data
Table 1. Histotripsy treatment groups.
Figure 1. (A) Schematic and (B) Photo of the experimental setup. The anesthetized mouse (i) was placed on the treatment platform (ii) which was secured to the degassed water tank such that only the mouse head was submerged in the water. The tank was continuously degassed throughout the experiment with a degassing system comprising a vacuum pump and membrane filter. The eight-element transducer (iii) was aligned with the center of the tumor via a three-axis motor positioning system, which was controlled by MATLAB. The transducer driving electronics were powered by a high-voltage source.
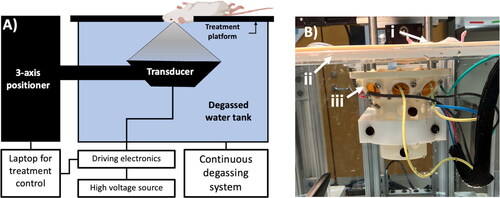
Figure 2. Representative pre- and post-treatment BLI images for all (A) Treatment groups and (B) pre- and post-treatment flux (p/s) for all treatment groups. BLI signals were reduced after histotripsy treatment for all treatment levels, with a significant reduction in the 10 PPL multi-point treatment group.
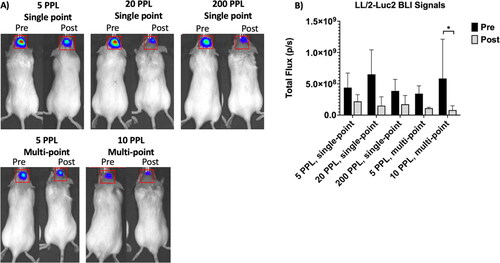
Figure 3. Proportion of tumor ablation (A) and residual tumor (T) at different dosages for GL261 (top) and LL/2-Luc2 (bottom) tumors. Tumor ablation generally increased with increasing dose (total number of histotripsy pulses applied) for both cell lines. All scale bars = 1 mm.
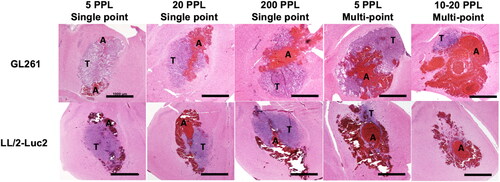
Figure 4. GL261 and LL/2-Luc2 tumor ablation at the (A–D) treatment region and (E–H) boundary for low (5 PPL, single-point) and high (10–20 PPL, multi-point) dosages. Both dosages for both cell lines showed fractionated and apoptotic tumor nuclei (arrows) surrounded by red blood cells at the ablation (a) regions with viable nuclei in the untreated tumor (t) regions. Surrounding brain (b) is for the most part unremarkable; high dosages show occasional ischemic neurons immediately adjacent to the tumor (asterisks).
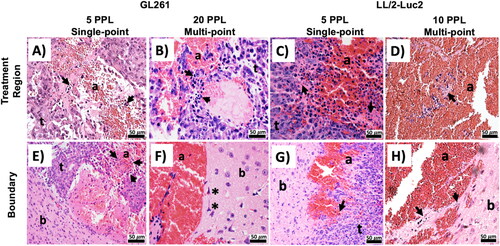
Figure 5. (A) H&E staining (40×) for untreated GL261 and (B) LL/2-Luc2 tumors. Both tumors show solid, dense, hypercellular growth with large, atypical nuclei and prominent mitotic activity (circles). GL261 tumors tend to grow in more circumscribed pattern, while LL/2-Luc2 tumors show more aggressive growth with tumor islands infiltrating surrounding parenchyma and perivascular spaces.
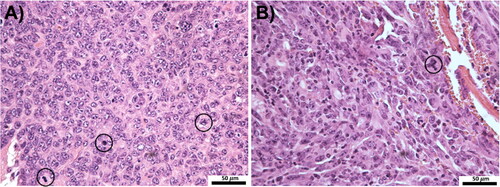
Figure 6. Representative pre- and post-treatment T2-weight MRI for GL261 tumors. Each column represents one mouse. The tumor (T) is represented by a hyperintense region in the pre- and post-treatment images, and the ablation zone (black outline) is represented by a hypointense region with a hyperintense core in the post-treatment images. The ablation volume increased with increasing dosage. All scale bars = 2 mm.
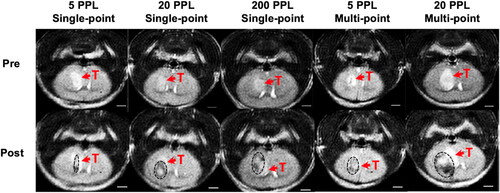
Figure 7. Representative pre- and post-treatment T2-weight MRI for LL/2-luc2 tumors. Each column represents one mouse. The tumor (T) is represented by a hypointense region in the pre-treatment images, and the ablation zone (black outline) is represented by a larger hypointense region in the post-treatment images. Ablation regions increased with dosage. All scale bars = 2 mm.
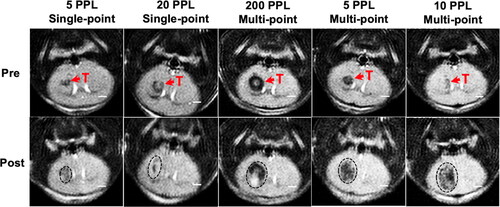
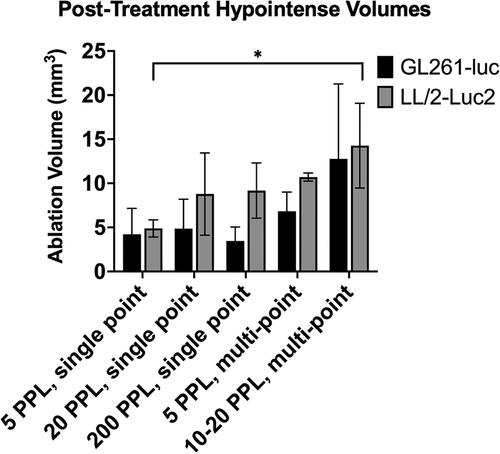
Figure 8. Post-treatment hypointense volumes measured from T2-weighted MRI. Hypointense volumes generally increased with increasing dosage for both cell lines, with a significant increase between single-point 5 PPL treatment and multi-point 10 PPL treatment for LL/2-Luc2 tumors.
Data availability statement
The datasets used and/or analyzed for the current study are available from the corresponding author upon reasonable request.