
Figures & data
Figure 1. Typical change in the gray scale of fibroadenoma on the dynamic realtime ultrasound image during HIFU treatment. (a) Before treatment, ultrasound image showed a hypoechoic breast fibroadenoma. The distance from the shallow margin of the fibroadenoma to the skin and the distance from the deep margin of the fibroadenoma to the pectoralis major were measured. (b) During HIFU, a significant gray scale changes was observed (white arrow). (c) Once the significant gray scale changed area covered the whole fibroadenoma, the procedure was terminated.
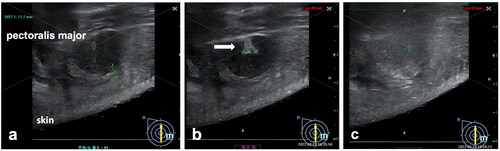
Figure 2. CEMRI images of a 27-year-old woman with bilateral breast fibroadenomas. Before HIFU, T1-weighted fat-suppressed CEMRI images showed hyperintensity masses in the right breast (a) and the left breast (c). The day after HIFU, CEMRI images showed nonperfused ablated zones in the right breast (b, white arrow) and the left breast (d, white arrow). A rim of enhancing tumor in the bottom section of one fibroadenoma in the left breast was shown in the CEMRI images (d, red arrow).
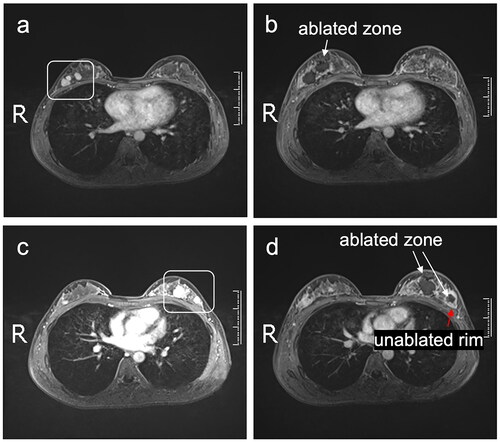
Figure 3. Before HIFU, ultrasound images showed fibroadenomas with clear boundary (A(a), B(a)). (A(b)) Six months after treatment, US images showed an enlarged hypoechoic zone without blood flow signal, suggesting a postoperative change. (B(b)) Six months after treatment, US images showed a typical reduced hypoechoic ablation zone.
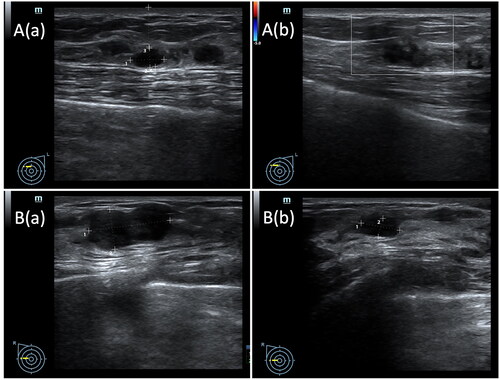
Table 1. Basic characteristics of patients (n = 85).
Table 2. Basic characteristics of breast fibroadenomas (n = 147).
Table 3. USgHIFU treatment results for breast fibroadenomas (n = 147).
Figure 4. Percentages and exact numbers of the four states of fibroadenomas at 3–6 months, 6–12 months and >12 months post-ablation, including complete disappeared, reduction, stability and enlargement.
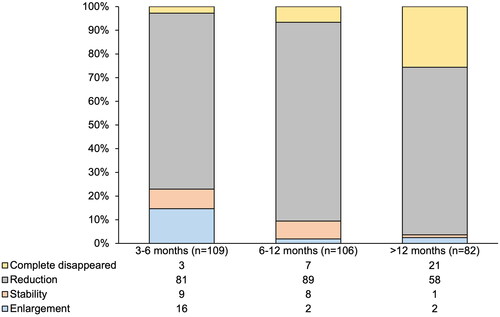
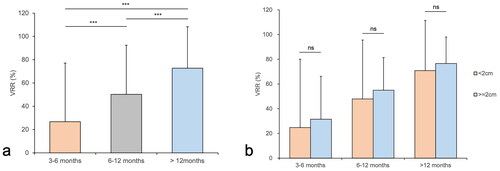
Figure 5. VRR of fibroadenomas at 3–6 months, 6–12 months and >12 months post-ablation. (a) VRR of all the fibroadenomas during follow-up. ***p < .001. (b) No differences were found in VRR at the follow-ups between two subgroups of lesions <2 cm and lesions ≥2.0 cm in size. ns, p > .05.
Data availability statement
All data are fully available upon reasonable request. The corresponding authors should be contacted if someone wants to request the data.