
Figures & data
Figure 1. Schematic drawings of MRI classification of adenomyosis (upper) and the corresponding examples (lower). (A) Type I, intrinsic focal adenomyosis (arrows); (B) type II, extrinsic focal adenomyosis (arrows); (C) type III, intramural focal adenomyosis (arrows); (D) type IVa, diffuse adenomyosis with unilateral myometrium involved (arrows); (E) type IVb, diffuse adenomyosis with bilateral myometrium involved.
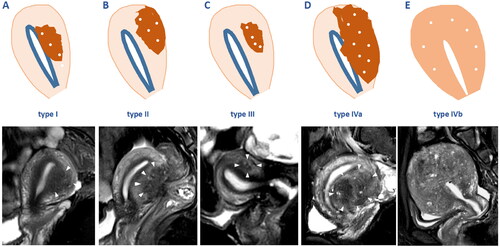
Figure 2. Diagrams of the of 3D reconstruction of MRI. With the adenomyotic lesion (arrows) identified clearly on T2WI (A), the segmentation could be accomplished by marking the target in red and the surrounding structures in blue (D) on 3 ∼ 5 different planes. By activating the reconstruction function, the system could identify the outline of the target automatically (B,C) by analyze the signal intensity and distribution of the marked area. After all the targets were reconstructed, a vivid 3D map reflecting the spacial relationship between the adenomyotic lesion (pink) and endometrium (yellow), uterine corpus (purple), and bladder (red) could be generated (E). The system will automatically identify the numbers of pixels inside and the reconstructed structure, and calculate the volume and surface area measurement values (F).
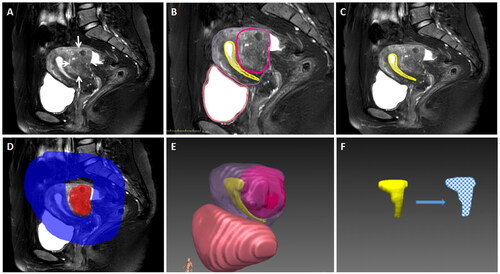
Figure 3. 3D reconstruction of MRI before and after ablation in a case of Extrinsic adenomyosis located at the posterior wall (type II). A 37 year-old woman who presented with HMB, had focal adenomyosis located at the posterior wall (type II) (A). 3D reconstruction of pre-ablation MRI showed that the volume of uterine corpus, adenomyotic lesion and endometrium was 209.74 ml, 38.8ml, and 8.76 ml respectively; the baseline ISA of EMJ was 34.1 cm2 (B,C). Post-ablation MRI showed obvious edema around the ablation zone (D), without any damage to the ipsilateral EMJ (E). 3D map after treatment showed no overlap between ablation zone and EMJ (arrows) (F). The NPVr reached 98.3%, the ablation rate of EMJ was 0. During the follow-up, this patient had PR at 3 months, NR at 6 and 12 months after treatment.
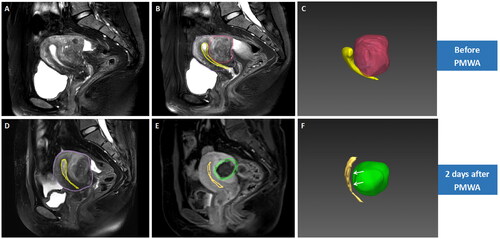
Figure 4. 3D reconstruction of MRI before and after ablation in a case of diffuse adenomyosis with unilateral myometrium involved (type IV). A 44 year-old woman who presented with HMB, had diffuse adenomyosis with the posterior myometrium involved (type IV) (A). 3D reconstruction of pre-ablation MRI showed that the volume of uterine corpus, adenomyotic lesion and endometrium was 180.2 ml, 44.5 ml, and 7.9 ml, and the baseline ISA of EMJ was 36 cm2 (B,C). Post-ablation MRI showed obvious decrease of the SI of the endometrium (D), and no perfusion was observed on the ipsilateral EMJ (arrows) (E). 3D map after treatment showed slight overlap between ablation zone and EMJ (arrows) (F). The NPVr reached 85.7%, and the ablation rate of EMJ was 14.6%. During the follow-up, this patient had PR at 3 months, NR at 6 and 12 months after treatment.
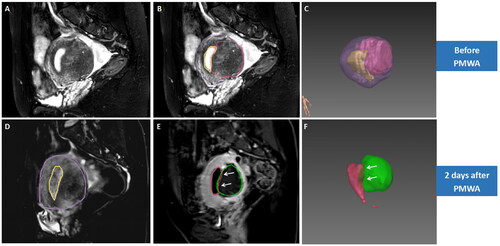
Figure 5. 3D reconstruction of MRI before and after ablation in a case of diffuse adenomyosis with bilateral myometrium involved (type IV). A 44 year-old woman who presented with HMB and frequent menses, had diffuse adenomyosis (arrows) with bilateral myometrium involved (type IV) (A). 3D reconstruction of pre-ablation MRI showed that the volume of uterine corpus, adenomyotic lesion and endometrium was obtained as 187.5 ml, 76.5 ml, and 4 ml respectively, and the baseline ISA of EMJ was 28.9 cm2 (B,C). Post-ablation MRI showed obvious decrease in the SI of the endometrium (D), and no perfusion was observed on the ipsilateral EMJ (arrows) (E). 3D reconstruction map after treatment showed that more than half of the endometrium was wrapped by the ablation zone (arrows) (D & F). The NPVr reached 93.6 %, and the ablation rate of EMJ was 84.4 %. During the follow-up, this patient had CR of AUB at 3, 6 and 12 months after treatment.
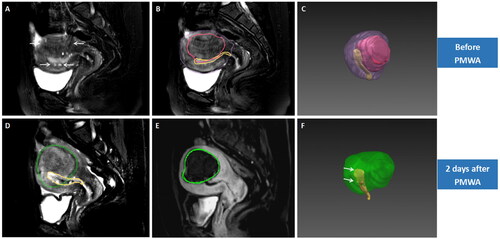
Table 1. Baseline characteristics of the study population, means ± SD or median (P25-P75).
Table 2. Clinical outcome of patients with AUB-a within one year after PMWA treatment.
Table 3. Comparison of the baseline information and local response indicators between patients with CR and PR/NR outcome, means ± SD or median (P25-P75).