
Figures & data
Figure 1. Experiment schematics and setup. (a) overall schematic diagram of complicated tissue acoustic model (pig skin, ox liver and pig rib); (b) complicated tissue acoustic model (left) and location diagram of thermocouples (right); (c) animal experiment setup images; (d) typical real-time sonographic image of HIFU treatment.
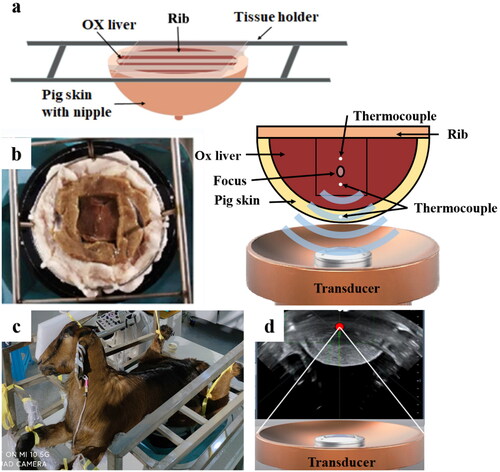
Figure 2. Comparison of the Morphological differences of focus between the JC and JCQ-B transducers. (a and b), the focal morphology (orange arrow) in an ideal acoustic field (degassed water). (c and d), the focal morphology (orange arrow) in an inorganic acoustic field (cis-polybutadiene rubber). (e and f), the BFR morphology in ox liver in the tissue acoustic model. BFR, biological focal region.
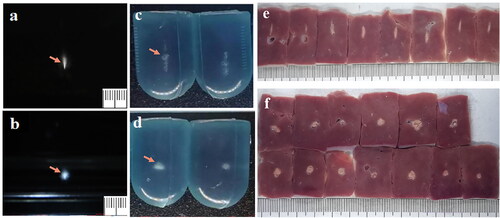
Table 1. Comparison of the length, width and length-width ratio between the JC and JCQ-B transducers in cis-polybutadiene rubber (sonication energy: 500 J) and ox liver tissue acoustic model (sonication energy: 1500 J).
Figure 3. Hyperechoic changes in focal area in in vitro model and comparison of the biological effects and safety between the JC and JCQ-B transducers in ox liver tissue acoustic model under the same sonication parameters. (a) hyperechoic changes in the focal area generated by JC and JCQ-B transducers. (b) coagulation necrosis volume; (c) EEF, energy efficiency factor; (d) the increase of temperature in the subcutaneous area; (e) the increase of temperature in the near acoustic field; (f) the increase of temperature in the far acoustic field.
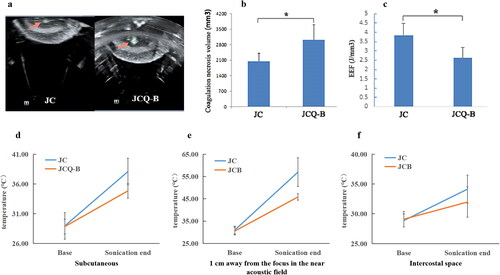
Figure 4. The US imaging of the goat mammary gland. (a) hypoechoic US imaging characteristics of the mammary gland before sonication. (b) hyperechoic scale change of US imaging appeared in the focus region after the JCQ-B transducer sonication (sonication energy: 6000 J). The US images of normal tissue (c) versus post-ablation tissue (d) in the mammary gland 7 days after sonication.
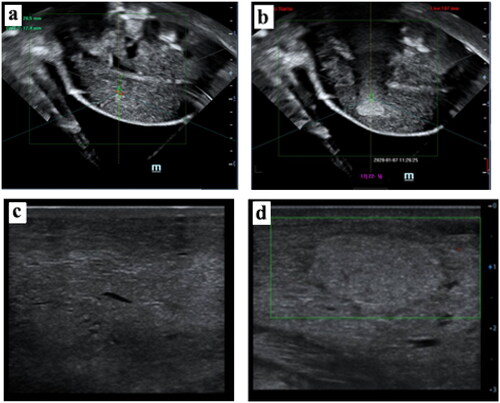
Figure 5. Pathologic images of the goat mammary gland after the JCQ-B transducer sonication. (a and b) macroscopic view of the ablated area before and after TTC staining. (c) a complete view of the ablated area and surrounding normal tissue with H&E staining (6.7×). (d and e) local magnification of (c) (white square, 40× and 100×, respectively). There was hyperemia and edema (H) between the coagulation area (C) and the normal tissue (N). (f-i) histological images of normal tissue (black square) (5f, 200× and 5h, 400×) and ablated tissue (white square) (5 g, 200× and 5i, 400×). (j-m), from (a) specimen, normal tissue (red arrow in a) and ablated tissue (white arrow in Citation5(a)) were taken. TEM images of normal tissue (5j, 6000× and 5 l, 12,000×) and ablated tissue were shown. (5k, 6000 × and 5 m, 10,000×).
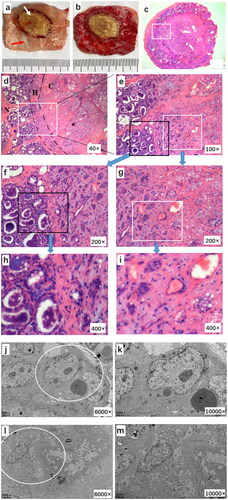
Figure 6. Tissue safety in the acoustic pathway of the JCQ-B transducer (sonication energy: 6000 J). (a–c), goat breast skin before (6a), immediately after (6b) and 7 days (6c) after sonication. (d–f), no observed damage of the subcutaneous tissue (6d), the mammary gland surface (6e) and the fascia of abdominal wall (6f) after sonication in macroscopic view. (g–i), no histological skin tissue damage after sonication via H&E staining (6 g, 40×; 6h, 100×; 6i, 200×). (j–l), no histological tissue fascia damage after sonication by H&E staining (6j, 40×; 6k, 100×; 6 l, 200×). (m–o), no histological abdominal muscle tissue damage after sonication by H&E staining (6 m 40×; 6n, 100×; 6o, 200×). (p–u), safety comparison between the Haifu system JC and JCQ-B transducers. Before (6p), immediately after (6q) and 7 days (6r) after the JC transducer sonication, breast skin damage was observed in two locations (red oval). before (6s), immediately after (6t) and 7 days (6 u) after the JCQ-B transducer sonication, there was no breast skin damage.
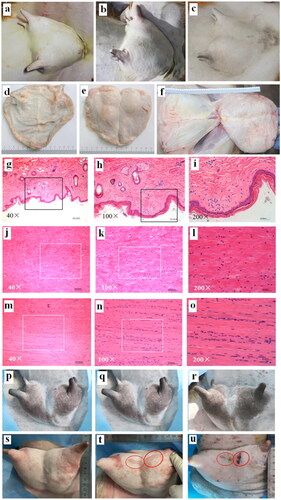
Table 2. Comparison of the length, width and length-width ratio between the JC and JCQ-B transducers with goat mammary Glands (sonication energy: 6000 J).
Data availability statement
The datasets generated or analyzed during the study are available from the corresponding author on reasonable request.