Figures & data
Figure 1. (A) B-mode ultrasonography images of VX2 breast tumor areas in each group before and immediately after HIFU ablation. After ablation, the sonographic images of each group showed obvious enhancement of tumor echo; (B) Quantitative calculation of approximate tumor volume before and after ablation by B-ultrasonography; (C) Observation of the extent of coagulation necrosis in each group. (D) Quantitative calculation of tumor volume in two group by TTC staining (n = 5, *p < 0.05, **p < 0.001).
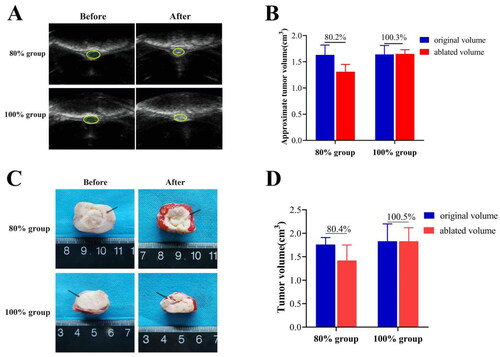
Figure 2. The appearance of tumor tissue damage and the Observation of H&E staining after HIFU ablation in different areas at 1st day (A) and 21st days (B) (the thin black arrow in the tumor tissue refers to the purplish red hyperemic zone surrounding the ablation zone, while the thick arrow in H&E refers to the appearance of tumor ablation junction area, scale bar = 200 μm).
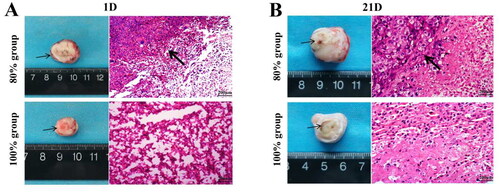
Figure 3. Changes of tumor volume and body weight of tumor bearing rabbits in different group within 21 days. (A) The curve diagram of tumor volume in each group of tumor bearing rabbits; (B) Calculation of tumor inhibition rate in each group at 21 days after HIFU ablation; (C)The tumor appearance observation of each group of tumor bearing rabbits; (D) The curve graph of the change of body weight of each group 21 days after HIFU ablation (n = 5, *p < 0.05, **p < 0.001, scale bar =10mm).
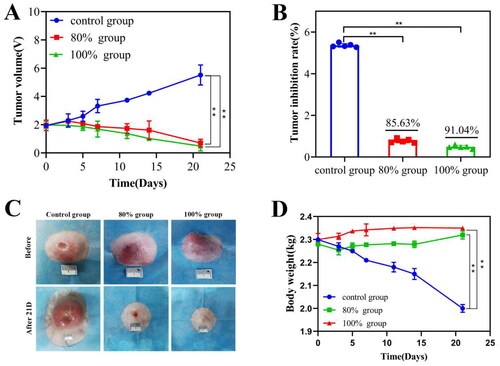
Figure 4. Tumor cell apoptosis was observed by TUNEL staining in each group after HIFU ablation in different range. (A) Observation of TUNEL fluorescence staining under confocal laser microscopy; (B) Fluorescence intensity analysis of TUNEL expression in each group at different time points after HIFU ablation (n = 5, *p < 0.05, **p < 0.001, scale bar = 100 μm).
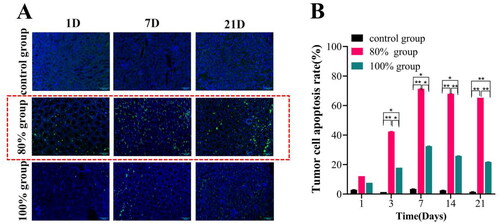
Figure 5. The immunohistochemical analysis of PCNA and CD31 in each group after HIFU ablation in different range. Representative images of PCNA(A) and CD31(C) after 21 day of HIFU ablation in each group. Semi-quantitative analysis of PCNA(B) and CD31(D) positive expression at different time after ablation via AOD value (n = 5, *p < 0.05, **p < 0.001, scale bar = 100 μm).
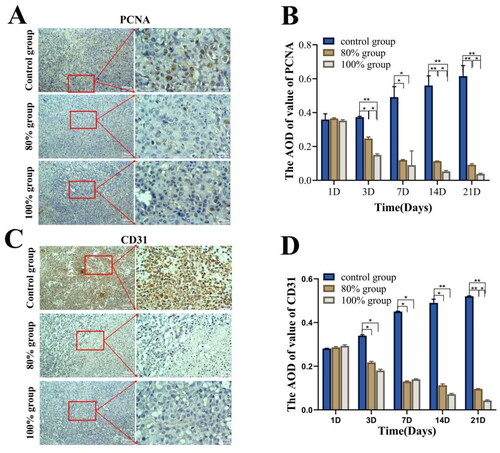
Figure 6. The expression levels of blood immune factors TGF-β1 (A), IL-2R(B), IL-6(C), IL-8(D), HSP-70(E) and INF-γ(F) were detected by ELISA in each group after HIFU ablation. (n = 5, *p < 0.05, **p < 0.001).
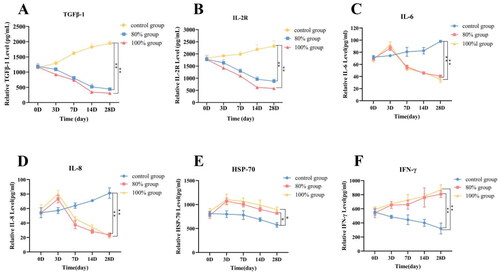
Figure 7. Observation of distant metastasis of tumors in each group after 28 days of HIFU ablation. (A) Macro-observation of distant metastasis of tumor after HIFU ablation. (B) Quantitative analysis of tumor metastasis rate after in different group. (C) Observation of distant metastasis of tumor by H&E staining (scale bar = 200 μm). the tumor metastasis in the two treatment groups was lower than that in the control group (p < 0.05). (n = 5, *p < 0.05, **p < 0.001).
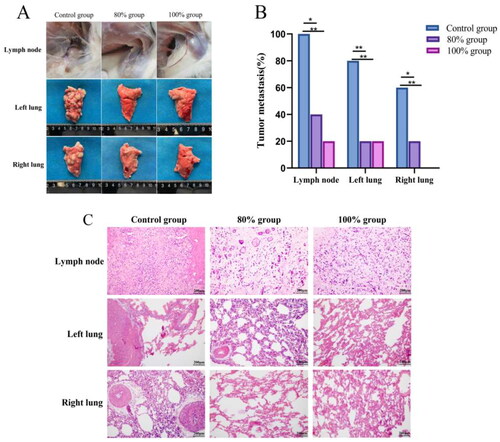
Table 1. Statistics on distant metastasis of tumors in each group at 28th day after HIFU ablation.
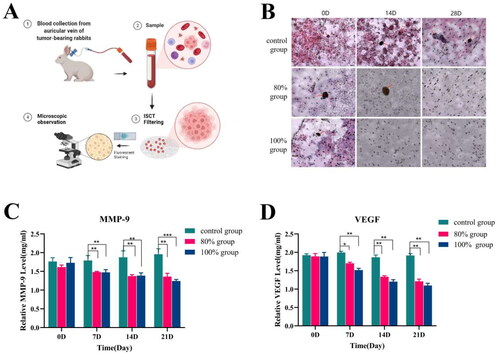
Figure 8. Expression detection of tumor distant metastasis-related after HIFU incomplete ablation. (A)Schematic diagram of enrichment of CTCs by TSET device; (B)Detection of circulating tumor cells in each group at different time points after HIFU ablation (scale bar = 200 μm); (C)Expression level of MMP factor; (D) Expression level of VEGF factor (n = 5, *p < 0.05, **p < 0.001).