
Figures & data
Figure 1. Patient inclusion flowchart.
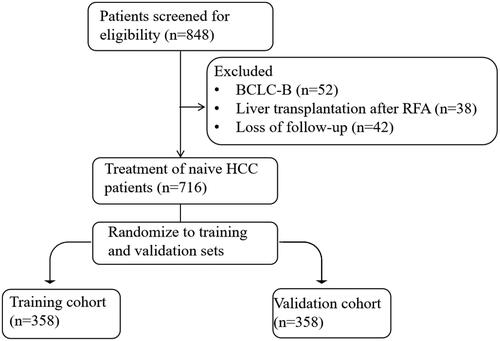
Table 1. Baseline demographics and clinical characteristics in 716 patients.
Table 2. Univariable and multivariable analyses of factors associated with progression-free survival and overall survival.
Figure 2. Graphs Depict performance of the Cox proportional hazards model of the at and ATA scores. (A) From the 1,3,5-year progression-free survival aspect, the time-dependent AUC of the training set was 0.651,0.667, and 0.620, respectively. (B) while the AUC of the validation set was 0.657, 0.687, and 0.704, respectively. (C) From the 1,3,5-year overall survival aspect, the time-dependent AUC of the training set was 0.680,0.712, and 0.666, respectively. (D) while the AUC of the validation set was 0.712, 0.706, and 0.726, respectively.
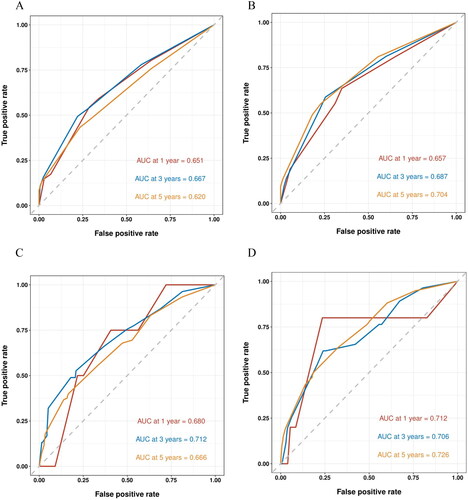
Figure 3. Graphs Show comparison Kaplan–Meier curves of (A) progression-free survival (PFS) between low-risk (at score constructed from AFP and TBS [at score] < 7) and high-risk (at score ≥7) patients; (B)overall survival (OS) between low-risk (ATA score constructed from AFP, TBS, and ALBI [ATA score] < 5) and high-risk (ATA score ≥5) patients.
![Figure 3. Graphs Show comparison Kaplan–Meier curves of (A) progression-free survival (PFS) between low-risk (at score constructed from AFP and TBS [at score] < 7) and high-risk (at score ≥7) patients; (B)overall survival (OS) between low-risk (ATA score constructed from AFP, TBS, and ALBI [ATA score] < 5) and high-risk (ATA score ≥5) patients.](/cms/asset/406a97ea-a4a4-405e-b6d5-6b61866cdbad/ihyt_a_2256498_f0003_c.jpg)
Table 3. Prognostic performance of different staging systems in the validation cohort.