
Figures & data
Figure 1. A comparative Illustration of conventional USgFUS technology and the proposed AI-assisted USgFUS for precise monitoring of FUS treatment. The traditional approach relies on grayscale variations in ultrasound B-mode images to visualize the ablated area, while our novel method employs AI-assisted labeling and real-time highlighting for quantitative and accurate assessment of FUS treatment progress.
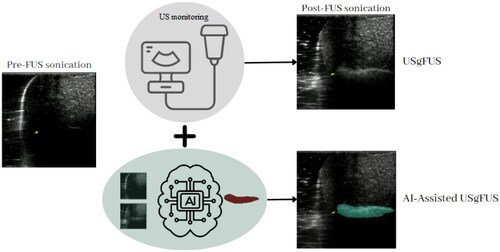
Figure 2. Ex vivo USgFUS experimental setup. The arrangement comprises two main components: a robotic-assisted FUS unit responsible for precise positioning of the focal region within the chicken tissue, and a robotic-assisted imaging unit employing a linear ultrasound transducer to meticulously monitor the FUS procedure with high precision.
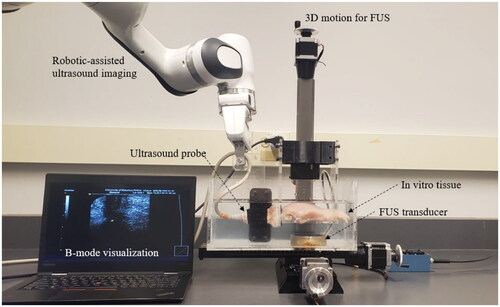
Figure 3. Schematic representation of the FUS system and its components. The system employs a single-element transducer (Model H-101, Sonic Concepts) for generating FUS, driven by a function generator (33210 A, Hewlett Packard), an RF amplifier (A-500, Electronic Navigation Industries), and an acoustic matching network (Sonic Concepts), all integrated into the FUS unit. A 3D motion system (5410 CNC Deluxe Mill, Sherline) is attached to the FUS transducer for accurate control of the focal region within the target tissue. B-mode images of the focal area are captured using a linear ultrasound probe (Ultrasonic Scanner Accuvix XQ) for FUS monitoring, with a robotic arm (Panda, Franka Emika GmbH) providing precise control of imaging.
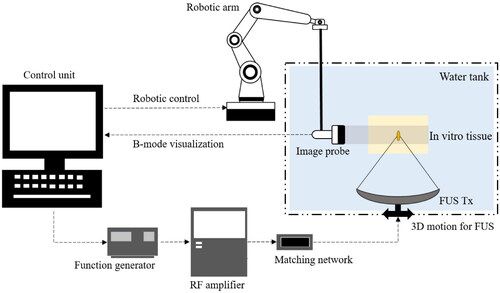
Figure 4. AI algorithm used in conjunction with US imaging. B-mode images captured before and after FUS treatment undergo a preprocessing stage, in which they are Clipped to a predefined surgical region based on prior knowledge. These images are then resized to 224 × 224 grayscale resolutions. Subsequently, the images and their pixel-wise difference are concatenated to generate a three-channel image. This image serves as the input for the Swin-Unet model, which produces the segmented region of the FUS ablation as its output.
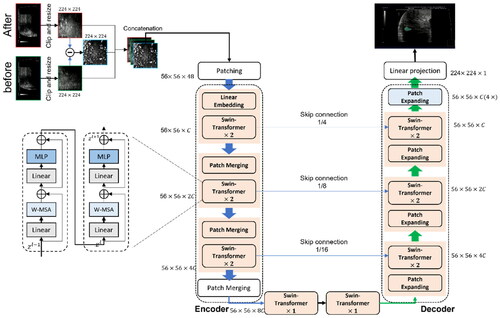
Figure 5. Ultrasound B-mode images captured at various acoustic power levels (
and
) during FUS sonication. Each image set demonstrates pre- and post-FUS sonication B-mode images, as well as AI-labeled B-mode images indicating the ablated area. Two rows of images represent two consecutive FUS sonication events; the top row corresponds to the initial
FUS sonication, and the bottom row corresponds to the subsequent
sonication. The second sonication took place
cm away from the ablated region created by the first sonication, following a 30-s cooling period.
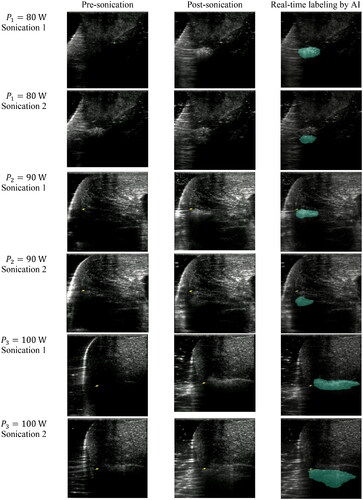
Figure 6. Detailed performance analysis of the proposed segmentation framework. Orange pixels represent under-segmented areas where the framework did not accurately delineate the regions. In contrast, yellow pixels correspond to accurately segmented regions, showcasing the framework’s effectiveness. Lastly, green pixels indicate over-segmented regions, where the framework has segmented beyond the actual boundaries.
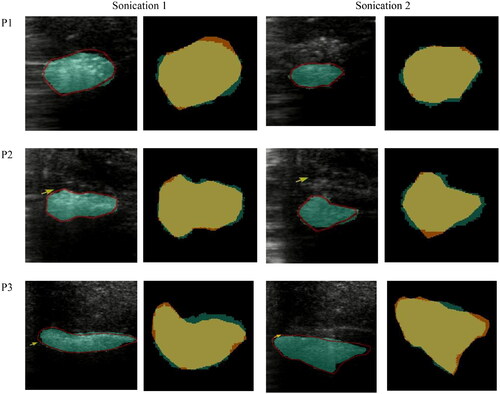
Table 1. Quantitative evaluation of the proposed segmentation framework performance using Mean Absolute Errors (MAE) and Dice Scores for six distinct sonication events.
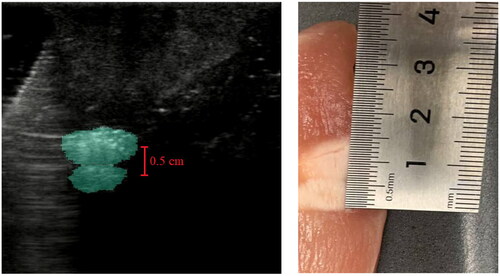
Figure 7. Comparison of AI-labeled B-mode ultrasound image with photographs of chicken sample post-ablation from sonications 1 and 2 at.
Data availability
The code and data used in this publication are publicly available at https://github.com/hosseinbv/HIFU_Segmentation.git. The repository contains all the code used to generate the results reported in the paper, as well as the datasets and pre-trained models used in the experiments.