
Figures & data
Figure 1. Goniometry measurement of the ankle range of motion with the knee stabilized in (a) full extension, (b) 90 degrees of flexion, and (c) 135 degrees flexion, While the angle of the ankle at maximal dorsiflexion is measured.
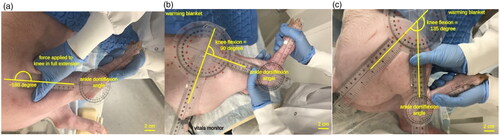
Figure 2. Experimental setup for MRgFUS treatment.
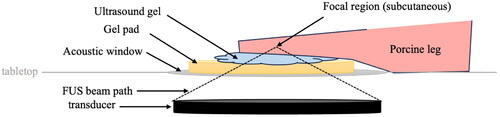
Table 1. Summary of MRI and PRF-Based MRT pulse sequence parameters.
Figure 3. T2-weighted MRI image of the Achilles tendon used in the treatment planning of MRgFUS sonication. Treatment position is verified in (a) sagittal, (b) axial, and (c) coronal views.
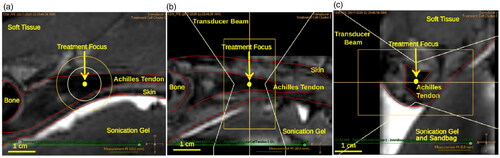
Figure 4. T2-weighted MRI image of Achilles tendon with area Outlining 240 cumulative equivalent min at 43 °C (240CEM) at three time points: (a) immediately after treatment, (b) 1 min after treatment, and (c) 5 min after treatment.
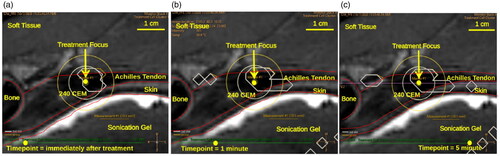
Figure 5. T2-weighted MRI image of the Achilles tendon with proton Resonance frequency shift MR thermometry (PRFS-MRT) at the end of MRgFUS sonication showing the maximum temperature achieved during sonications. Temperature mapping corresponds to the scale displayed on the right for PRFS-MRT in (a) sagittal, (b) axial, and (c) coronal views.
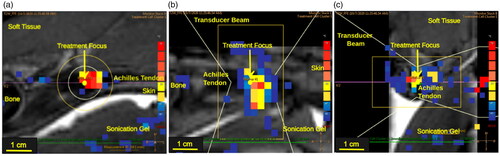
Figure 6. (a) Optimal cutoff point and distribution by class of a number of tendon disruptions by energy delivered and (b) receiver operator curve with optimal sensitivity is of 0.91 with a specificity of 0.83 while giving sensitivity and specificity the same priority.
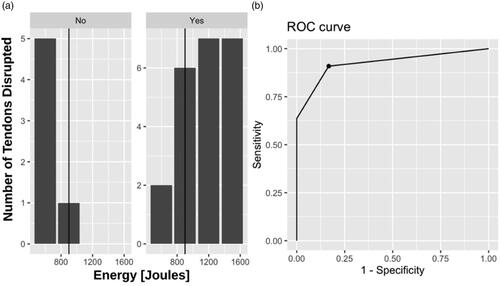
Table 2. Summary of tendon disruption for each energy delivered per sonication.
Figure 7. The difference in ankle ROM following MRgFUS treatment with a knee at (a) full extension (0 degrees), (b) at 90 degrees, and (c) at 135 degrees.
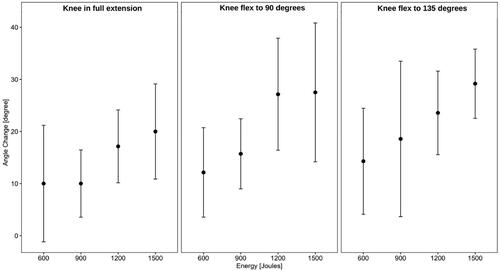
Figure 8. 240 CEM areas at three different time points (1) immediately after treatment, (2) 1 min after treatment, and (3) 5 min after treatment for each energy delivered per sonication.
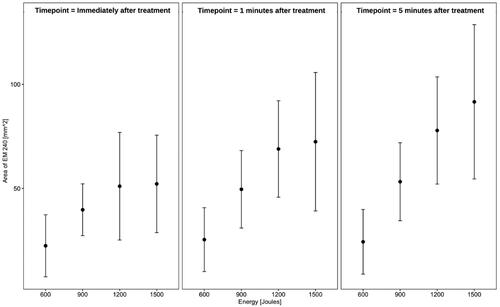
Table 3. Summary of 240 CEM area for each energy delivered per sonication.
Figure 9. Maximum temperature measured at three different time points (1) immediately after treatment, (2) 1 min after treatment, and (3) 5 min after treatment for each energy delivered per sonication.
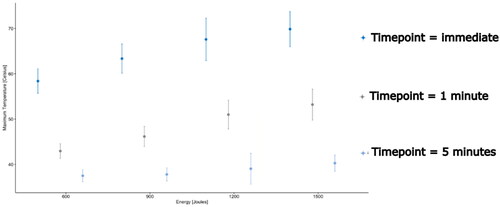
Figure 10. Temperature-time curves showing the hottest voxel temperatures during treatment and for five minutes of cooling for (a) a 20 W treatment and (b) a 40 W treatment.
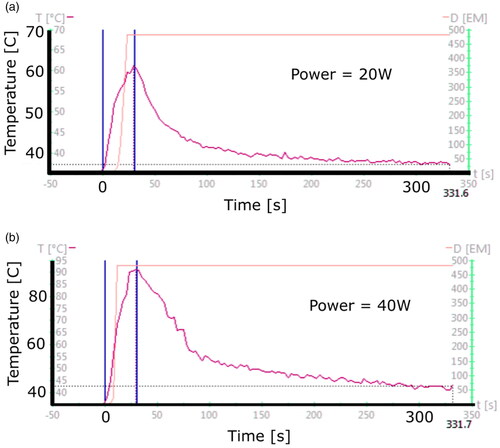
Table 4. Summary of maximum temperate achieved in a 3 × 3×3 voxel by energy delivered per sonication.
Figure 11. (a) Gross anatomy is a ruptured tendon with an area of tendon rupture. (b) Histology of ruptured tendon with fiber disruption in the zone of thermal coagulation. (c) Magnification in the border between normal collagen fiber and zone of thermal coagulation. (d) Magnification in border between a zone of thermal coagulation and the absence of collagen fibers due to disruption.
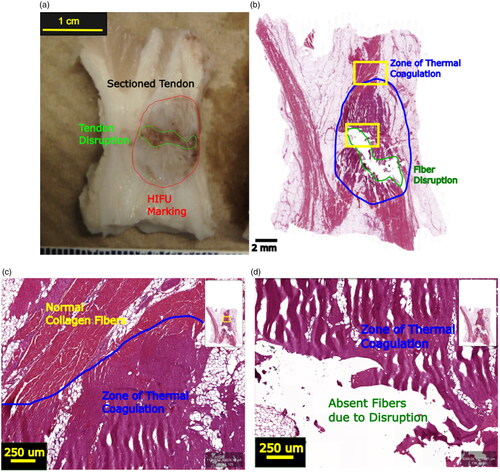
Table 5. Summary of skin necrosis depending on energy delivered.
Data availability statement
Raw data were generated at the Posluns Center for Image Guided Innovation and Therapeutic Intervention, The Hospital for Sick Children. Derived data supporting the findings of this study are available from the corresponding author WCK on request.