
Figures & data
Figure 1. Typical acoustic pressure waveform for mechanical high-intensity focused ultrasound (M-HIFU) and thermal high-intensity focused ultrasound (T-HIFU). PRP: pulse repetition period, PD: pulse duration, DC: duty cycle.
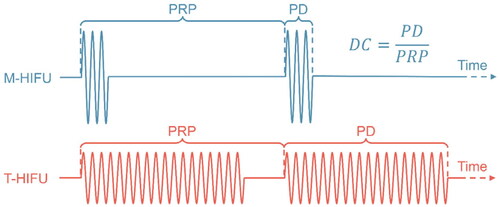
Table 1. Sonication parameters for histotripsy-assisted cancer immunotherapy pre-clinical studies.
Figure 2. Combination of M-HIFU and PD-L1 blockade enhanced the abscopal effect but could not eradicate distant tumors in a bilateral MM3MG-HER2 model. MM3MG-HER2 cells were implanted into the right thigh and left flank of BALB/c mice. Seven days later, M-HIFU was administered to right thigh tumors in the M-HIFU monotherapy and combination therapy groups. Anti-PD-L1 antibody (100 µg/inj) or isotype control IgG was intraperitoneally injected on days 10, 13 and 16. Tumor growth curves for treated and untreated tumors are shown. Data represent results from 2 pooled experiments. n = 13–19 per group; error bar, mean ± SD; *p < 0.05, **p < 0.01, ***p < 0.001, ****p < 0.0001.
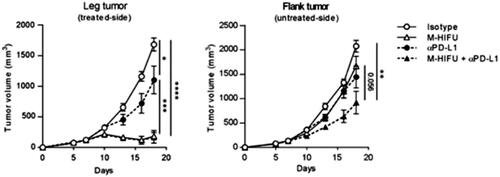
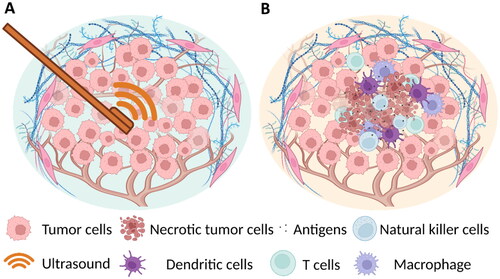
Figure 3. Schematic of intratumoral histotripsy immunotherapy. (A) Intratumoral sonication using an intracorporal, miniaturized ultrasound device. (B) Histotripsy-induced tumor cell necrosis and corresponding immunomodulation. Created with biorender.com.
Data availability statement
Raw data were generated at Duke University and North Carolina State University. Derived data supporting the findings of this study are available from the corresponding author [HKL] on request.