
Figures & data
Figure 1. Grey-scale and contrast-enhanced ultrasound of hepatocellular carcinoma in a 48-year-old male patient. (a) Grey-scale ultrasonography image showing a hypoechoic hepatic nodule. (b) Contrast-enhanced ultrasound in the arterial phase (21 s) showing hyperenhancement. (c) Contrast-enhanced ultrasonography image showing hypoenhancement in the late phase at 200 s.
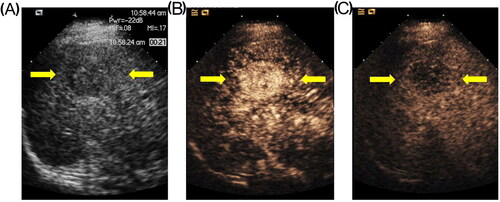
Figure 2. Grey-scale and contrast-enhanced ultrasound of microwave ablation area after the 50 W-5 min protocol. (a) Grey-scale ultrasonography image showing a hyperechoic nodule. (b) Illustration of the X- and Y-axes of the contrast-enhanced ultrasonography image. (c) Illustration of Z-axis on a contrast-enhanced ultrasound image.
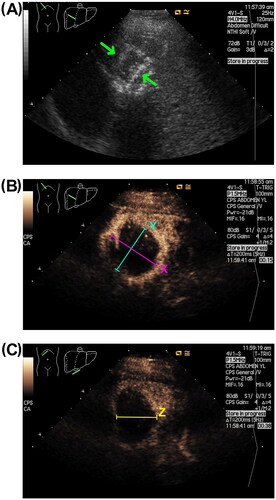
Figure 3. Contrast-enhanced ultrasound and time-intensity curves of hepatocellular carcinoma (HCC) and normal liver parenchyma. (a) Contrast-enhanced ultrasound image of the entire HCC (green line) and normal liver parenchyma (yellow line). (b) Time-intensity curves of the HCC (green line) and normal liver parenchyma (yellow line) obtained using the Sonoliver quantification software.
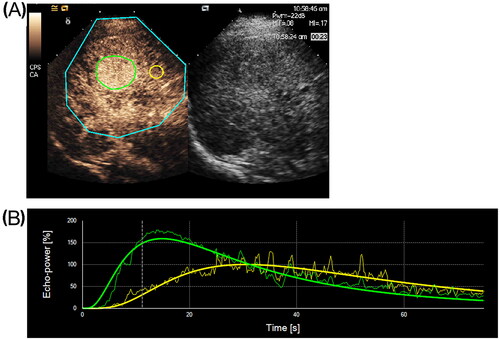
Table 1. Baseline characteristics of enrolled patients and tumors.
Table 2. Quantitative CEUS parameters extracted from time-intensity curves.
Figure 4. Regression analysis. Regression plot showing inverse linear correlations between the area under the curve and parameters of microwave ablation size, including the long-axis diameter (r = −0.661, p < 0.001), short-axis diameter (r = −0.566, p < 0.001), and volume (r = −0.785, p < 0.001).
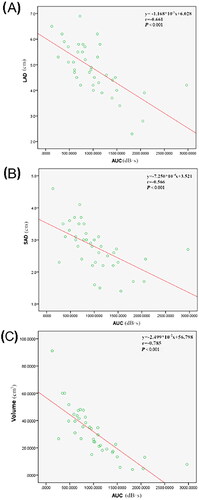
Table 3. Correlation analysis of AUC and size of MWA area.
Data availability statement
The data that support the findings of this study are available from the corresponding author upon reasonable request.