
Figures & data
Figure 1. The flowchart of patient enrollment.
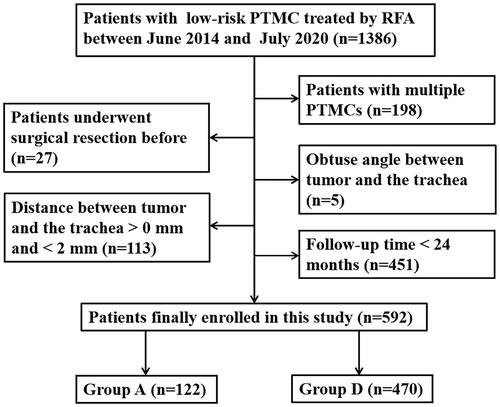
Figure 2. Ultrasound (US) images of the ablation procedure performed on a 31-year-old female with papillary thyroid carcinoma adjacent to the trachea. (a) US image displaying the tumor (arrowheads) before ablation; (b) the hydrodissection technique (arrows) was applied wherein normal saline was injected into the space between the tumor (arrowheads) and the trachea as well as the space between the anterior thyroid capsule and superficial soft tissue; (c) the ablation needle (arrows) was inserted into the target tumor using the trans-isthmic approach; the ablation was initiated from the deepest portion of the tumor and the portion closest to the trachea. The tumor was elevated away from the trachea using the operator’s finger as the fulcrum (utilizing the leverage pry-off method) to further increase the distance (double side arrow) between the tumor and the trachea during ablation; (d) the ablation needle (arrows) was moved toward to the superficial portion of the tumor (arrowheads).
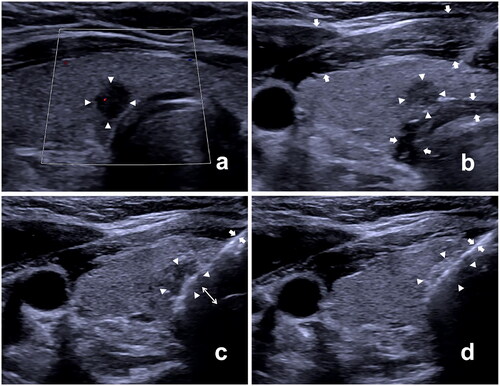
Figure 3. The US and contrast-enhanced ultrasound (CEUS) images were obtained in a 64-year-old male with papillary thyroid carcinoma adjacent to the trachea in the right thyroid lobe. (a,b) transverse and longitudinal planes of US images of the tumor (arrows) before RFA; (c,d) CEUS images illustrating non-enhancement in the ablation area (arrows) immediately after RFA; (e,f) CEUS images of the ablation area (arrows) at 1-month follow-up; (g,h) CEUS images of the ablation area (arrows) at 3-months follow-up; (i,j) the ablation area displaying scar-like non-enhancement (arrows) at 12-month follow-up; (k,l) the ablation area completely disappeared at the 18-month follow-up.
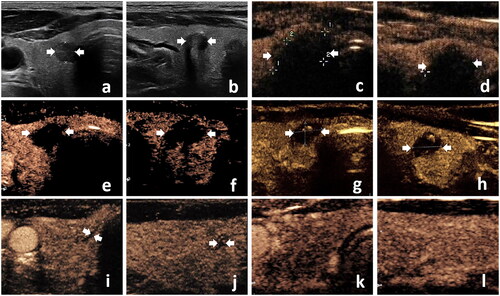
Table 1. Baseline characteristics of patients before and after propensity score matching.
Table 2. Changes in volume and VRR of PTMCs in adjacent and distant groups at each follow-up point.
Figure 4. Graph illustrating Kaplan–Meier curves for tumor disappearance rate between the adjacent and distant groups after propensity score matching.
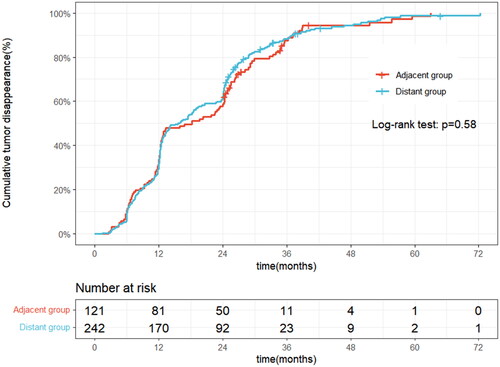
Figure 5. Graph displaying Kaplan–Meier curves for progression-free survival between the adjacent and distant groups after propensity score matching.
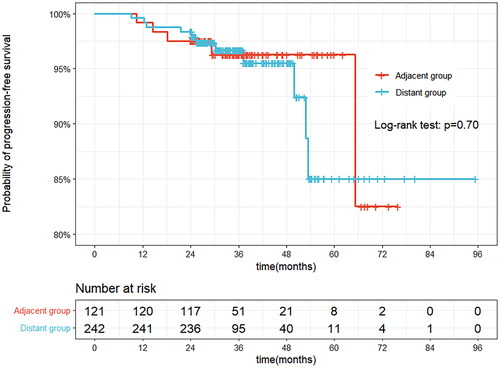
Table 3. Comparison of outcomes between adjacent and distant groups.
Table 4. Univariate and multivariate analyses of risk factors affecting disease progression.
Table 5. Comparison of complications between adjacent and distant groups.
Supplemental Material
Download MS Word (199.4 KB)Data availability statement
The data supporting the findings of this study are available from the corresponding author upon reasonable request.